To study the variation in friction factor, f, used in the Darcy Formula with the Reynolds number in both laminar and turbulent flow. The friction factor will be measured as a function of Reynolds number and the roughness will be calculated using the Colebrook equation.
The loss of head resulting from the flow of a fluid through a pipeline is expressed by the Darcy Formula
![]() 1.1
1.1
where hf is the loss of head (units of length) and the average velocity is V. The friction factor, f, varies with Reynolds number and a roughness factor.
The Hagen-Poiseuille equation for laminar flow indicates that the head loss is independent of surface roughness.
![]() 1.2
1.2
Thus in laminar flow the head loss varies as V and inversely as D2. Comparing equation 1.1 and equation 1.2 it can be shown that
![]() 1.3
1.3
indicating that the friction factor is proportional to viscosity and inversely proportional to the velocity, pipe diameter, and fluid density under laminar flow conditions. The friction factor is independent of pipe roughness in laminar flow because the disturbances caused by surface roughness are quickly damped by viscosity.
Equation 1.2 can be solved for the pressure drop as a function of total discharge to obtain
![]() 1.4
1.4
When the flow is turbulent the relationship becomes more complex and is best shown by means of a graph since the friction factor is a function of both Reynolds number and roughness. Nikuradse showed the dependence on roughness by using pipes artificially roughened by fixing a coating of uniform sand grains to the pipe walls. The degree of roughness was designated as the ratio of the sand grain diameter to the pipe diameter (e/D).
The relationship between the friction factor and Reynolds number can be determined for every relative roughness. From these relationships, it is apparent that for rough pipes the roughness is more important than the Reynolds number in determining the magnitude of the friction factor. At high Reynolds numbers (complete turbulence, rough pipes) the friction factor depends entirely on roughness and the friction factor can be obtained from the rough pipe law.
![]() 1.5
1.5
For smooth pipes the friction factor is independent of roughness and is given by the smooth pipe law.
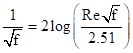 1.6
1.6
The smooth and the rough pipe laws were developed by von Karman in 1930.
Many pipe flow problems are in the regime designated “transition zone” that is between the smooth and rough pipe laws. In the transition zone head loss is a function of both Reynolds number and roughness. Colebrook developed an empirical transition function for commercial pipes. The Moody diagram is based on the Colebrook equation in the turbulent regime.
![]() 1.7
1.7
The Colebrook equation can be used to determine the absolute roughness, e, by experimentally measuring the friction factor and Reynolds number.
 1.8
1.8
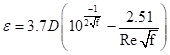
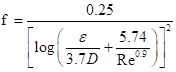
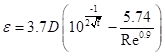
Alternatively the explicit equation for the friction factor derived by Swamee and Jain can be solved for the absolute roughness.
 1.9
1.9
When solving for the roughness it is important to note that the quantity in equation 1.9 that is squared is negative!
 1.10
1.10
Equations 1.8 and 1.10 are not equivalent and will yield slightly different results with the error a function of the Reynolds number.
The experimental apparatus consists of a pressure reducing valve, shutoff valve, flow control valve, a test section of tubing with pressure taps and a pressure transducer (Figure 1-1). The pressure-reducing valve is used to minimize the effects of pressure fluctuations in the tap water supply. A 10-cm-diameter volumetric detector will be used to measure the flow rates. A section of 3/8” OD tubing should be installed between the flow control valve and the test section so the flow can become laminar.
The experiment consists of measuring the head loss in a length of tubing as a function of discharge. Head loss will be measured in small diameter brass pipe using pressure transducers. Discharge will be obtained by measuring the volume of discharge over a time interval using a volumetric detector. An 85 cm section of tubing with an inside diameter of 3.4 mm will be used as the test section.
Table 1-1. Recommended measurements. |
|
Pressure transducer |
Desired head loss (cm) |
7 kPa |
1 |
7 kPa |
2 |
7 kPa |
4 |
7 kPa |
8 |
7 kPa |
16 |
7 kPa |
32 |
200 kPa |
64 |
200 kPa |
120 |
200 kPa |
250 |
200 kPa |
500 |
200 kPa |
1000 |
200 kPa |
max |
Table 1-2. Equipment list.
Description |
Supplier |
Catalog number |
Pressure transducer |
Omega |
PX26-001DV |
Pressure transducer |
Omega |
PX26-030DV |
Nupro angled 3/8 swage valve |
Rochester Valve & Fitting Co., INC. |
B-6JNA |
3/8" OD tubing |
Cole-Parmer |
H-06490-15 |
Pressure reducer |
ID Booth |
FB-38 |
Volumetric detector |
CEE shop |
|
Pipe test section |
|
|
Source: http://ceeserver.cee.cornell.edu/mw24/cee331/Labs/Determination%20of%20the%20Friction%20Factor%20in%20Small%20Pipes.doc
Web site to visit: http://ceeserver.cee.cornell.edu
Author of the text: indicated on the source document of the above text
If you are the author of the text above and you not agree to share your knowledge for teaching, research, scholarship (for fair use as indicated in the United States copyrigh low) please send us an e-mail and we will remove your text quickly. Fair use is a limitation and exception to the exclusive right granted by copyright law to the author of a creative work. In United States copyright law, fair use is a doctrine that permits limited use of copyrighted material without acquiring permission from the rights holders. Examples of fair use include commentary, search engines, criticism, news reporting, research, teaching, library archiving and scholarship. It provides for the legal, unlicensed citation or incorporation of copyrighted material in another author's work under a four-factor balancing test. (source: http://en.wikipedia.org/wiki/Fair_use)
The information of medicine and health contained in the site are of a general nature and purpose which is purely informative and for this reason may not replace in any case, the council of a doctor or a qualified entity legally to the profession.
The texts are the property of their respective authors and we thank them for giving us the opportunity to share for free to students, teachers and users of the Web their texts will used only for illustrative educational and scientific purposes only.
All the information in our site are given for nonprofit educational purposes