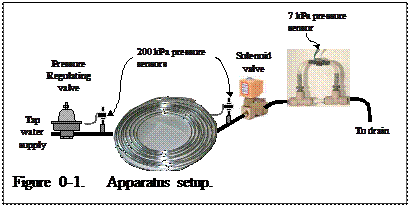
Measure the pressure trace after a sudden valve closure. Determine the pressure fluctuation period and determine if the system is best modeled as gradually varied (lumped) or rapidly varied (distributed). Develop a model to describe the velocity in the pipe given the measured pressure fluctuations.
A system can be modeled as gradually varied when the pressure fluctuation period (T) is much greater than the time for a sound wave to travel back and forth the length of the pipe twice.
![]() 3.1
3.1
where the speed of sound in a pipe is given by
 3.2
3.2
where the terms are defined in Table 3-1.
Table 3-1. Parameter values for water and for the aluminum and plastic tubing. |
||
K |
2.15 GPa |
Bulk Modulus of Elasticity for Water |
r |
1000 kg/m3 |
Density of water |
EAl |
69 GPa |
Bulk Modulus of Elasticity for Aluminum |
DAl |
3.86 mm |
ID of aluminum tube |
tAl |
1.016 mm |
Wall thickness of aluminum tube |
Ep |
0.8 GPa |
Bulk Modulus of Elasticity for plastic |
Dp |
4.318 mm |
ID of plastic tube |
tp |
1.245 mm |
Wall thickness of aluminum tube |
If the system is gradually varied then Newton’s 2nd law can be applied to describe the acceleration of water in the pipe. In finite difference form we have
![]() 3.3
3.3
where H is the difference in piezometric head between the ends of the pipe. The head loss is given by
 3.4
3.4
Given an intial flow rate (before closure of the valve) and pressure as a function of time at both ends of the pipe equations 3.3 and 3.4 can be used to predict the velocity of water in the pipe as a function of time using a finite difference solution.
If the system is rapidly varied then the magnitude of the pressure wave is predicted to be a function of the instantaneous change in velocity.
![]() 3.5
3.5
![]() 3.5
3.5
 Monitor the pressure sensors using Easy Data
  to open the solenoid valve. The valve should make a clicking noise as it opens.
Note that an offset error in the pressure sensor readings will cause a continuous increase in cumulative error in the model.
Here are some ideas to get your started…
Here is an idea for those of you who learn by playing. If you figured out where the water went when you closed the valve, try to modify your experimental apparatus so there was less available volume (or much more available volume) for the water to fill. Repeat the experiment (taking care not to rupture the pressure sensor!) and see how the system changes!
Acquire data at 500 Hz (Change the data frequency at the Data Server)
Save data locally to avoid clogging the intranet.
Table 3-2 Lab Materials |
||
Description |
Catalog |
Supplier |
Semirigid Polyethylene Tubing, 0.170" Id, 1/4" Od, 0.04" WALL Thk, 100’ Length, Translucent White |
5384K537 |
McMaster-Carr |
Bendable Aluminum Tubing, 0.152" Id, 1/4" Od, 0.049" Wall, 50' Length |
5177K25 |
McMaster-Carr |
Solenoid valve |
|
|
Stamp Box |
|
|
Flow control valve |
|
|
2-200 kPa pressure sensors |
|
|
1-7 kPa pressure sensor and flow sensor tube (1 mm x 5 cm) |
|
|
http://www.mech.northwestern.edu/courses/meb40/sol4.html
http://www.cwr.uwa.edu.au/cwr/teaching/fmLabs/fm_waterhammer/fm_waterhammer.html
Source: http://ceeserver.cee.cornell.edu/mw24/cee332/Lab/Transients.doc
Web site to visit: http://ceeserver.cee.cornell.edu
Author of the text: indicated on the source document of the above text
If you are the author of the text above and you not agree to share your knowledge for teaching, research, scholarship (for fair use as indicated in the United States copyrigh low) please send us an e-mail and we will remove your text quickly. Fair use is a limitation and exception to the exclusive right granted by copyright law to the author of a creative work. In United States copyright law, fair use is a doctrine that permits limited use of copyrighted material without acquiring permission from the rights holders. Examples of fair use include commentary, search engines, criticism, news reporting, research, teaching, library archiving and scholarship. It provides for the legal, unlicensed citation or incorporation of copyrighted material in another author's work under a four-factor balancing test. (source: http://en.wikipedia.org/wiki/Fair_use)
The information of medicine and health contained in the site are of a general nature and purpose which is purely informative and for this reason may not replace in any case, the council of a doctor or a qualified entity legally to the profession.
The texts are the property of their respective authors and we thank them for giving us the opportunity to share for free to students, teachers and users of the Web their texts will used only for illustrative educational and scientific purposes only.
All the information in our site are given for nonprofit educational purposes