Pump Performance Curves and Similarity Laws
Pump performance results are typically obtained from an experimental test of the given pump and are presented graphically for each performance parameter.
· Typical independent variable - Q {usually gpm (liquids) or cfm (gases)}
· Typical dependent variables are
H – head pressure rise, in some cases DP
BHP – input power requirements (motor size)
h – pump efficiency
· These are graphed for fixed pump speed for each impeller diameter in a given family of pumps
Typical performance curves for a single impeller speed and diameter appear as
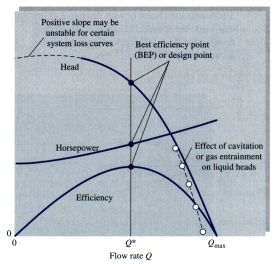
Fig. 11.6 Typical Centrifugal Pump Performance Curves
at Fixed Pump Speed and diameter
These curves are observed to have the following characteristics:
1. hp is approximately constant at low flow rate.
2. hp = 0 at Qmax.
3. BHP is not equal to 0 at Q = 0.
4. BHP increases monotonically with the increase in Q.
5. hp = 0 at Q = 0 and at Qmax.
6. Maximum pump efficiency occurs at approximately Q* = 0.6 Qmax . This is the best efficiency point BEP. At any other operating point, efficiency is less, pump head can be higher or lower, and BHP can be higher or lower.
7. At the BEP, Q = Q*, hp = hp*, BHP = BHP*.
Measured Performance Data
Actual pump performance data will typically be presented graphically as shown in Fig. 11.7. Each graph will usually have curves representing the pump head vs. flow rate for two or more impeller diameters for a given class/model of pumps having a similar design. The graphs will also show curves of constant efficiency and constant pump power (BHP) for the impeller diameters shown. All curves will be for a fixed pump impeller speed.
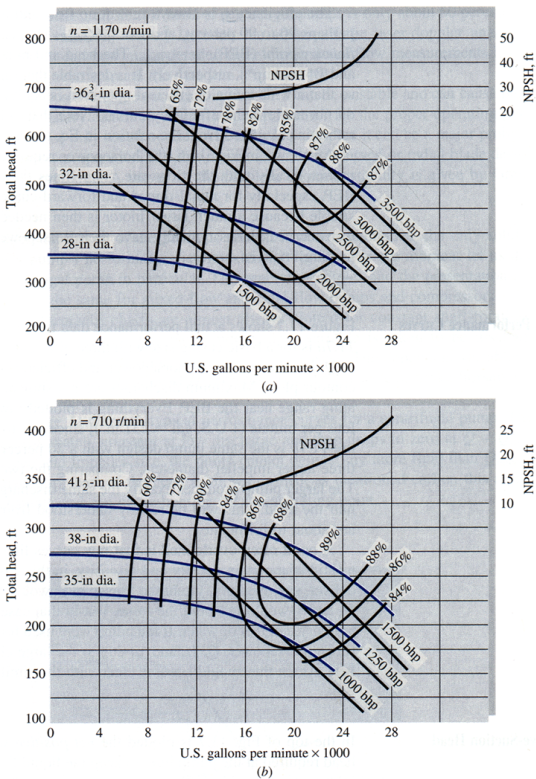
Fig. 11.7 Measured performance curves for two models of a centrifugal water pump
How to Read Pump Performance Curves
Care must be taken to correctly read the performance data from pump curves. This should be done as follows:
(1) For a given flow rate Q
(2) Read vertically to a point on the pump head curve h for the impeller diameter D of interest.
(3) All remaining parameters ( efficiency & BHP) are read at this point; i.e., graphically interpolate between adjacent curves for BHP to obtain the pump power at this point.
Note that the resulting values are valid only for the conditions of these curves:
(1) pump model and design, (2) pump speed – N, (3) impeller size – D, (4) fluid (typically water)
Thus for the pump shown in Fig. 11.7a with an impeller diameter D = 32 in, we obtain the following performance at Q = 20,000 gpm:
Q = 20,000 gpm, D = 32 in, N = 1170 rpm
H @ 385 ft, BHP @ 2300 bhp, hp @ 86.3 %
Note that points that are not on an h vs. Q curve are not valid operating points. Thus for Fig. 11.7b, the conditions
Q = 22,000 gpm, BHP = 1500 bhp, hp = 250 ft
do not correspond to a valid operating point because they do not fall on one of the given impeller diameter curves. However, for the same figure, the point
Q = 20,000 gpm, BHP = 1250 bhp
is a valid point because it coincidentally also falls on the D = 38 in impeller curve at hp = 227 ft.
Net Positive Suction Head - NPSH
One additional parameter is typically shown on pump performance curves:
NPSH = head required at the pump inlet to keep the fluid from cavitating.
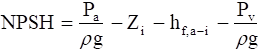
NPSH is defined as follows:
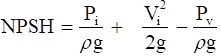
where Pi = pump inlet pressure
Pv = vapor pressure of fluid
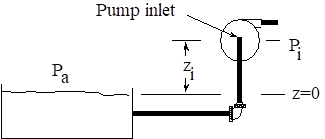
Considering the adjacent figure, write the energy equation between the fluid surface and the pump inlet to obtain the following: |
|
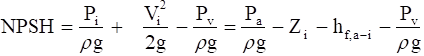
For a pump installation with this configuration to operate as intended, the right-hand-side of the above equation must be > the NPSH value for the operating flow rate for the pump.
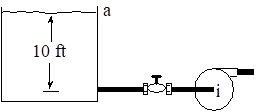
Example:
A water supply tank and pump are connected as shown. Pa = 13.6 psia and the water is at 20 o C with Pv = 0.34 psia. The system has a friction loss of 4.34 ft. Will the NPSH of the pump of Fig. 11.7a at 20,000 gpm work? |
|
Applying the previous equation we obtain
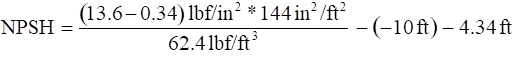
![]() The pump will work because the system NPSH as shown in Fig. 11.7a is 30 ft which provides a 6.3 ft safety margin. Conversely, the pump could be located as close as 3.7 ft below the water surface and meet NPSH requirements.
The pump will work because the system NPSH as shown in Fig. 11.7a is 30 ft which provides a 6.3 ft safety margin. Conversely, the pump could be located as close as 3.7 ft below the water surface and meet NPSH requirements.
Pump Similarity Laws
Application of the dimensional analysis procedures of Ch. V will yield the following three dimensionless performance parameters for centrifugal pumps:
Dimensionless flow coefficient: 
Dimensionless head coefficient: 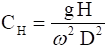
Dimensionless power coefficient: 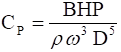
where w is the pump speed in radians/time and other symbols are standard design and operating parameters with units that make the coefficients dimensionless.
How are these used?
These terms can be used to estimate design and performance changes between two pumps of similar design.
Stated in another way:
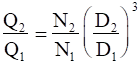
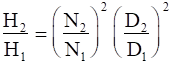
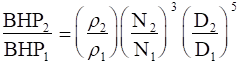
If pumps 1 and 2 are from the same geometric design family and are operating at similar kinematic and dynamic operating conditions, the flow rates, pump head, and pump power for the two pumps will be related according to the following expressions:
|
Used to predict the new flow rate for a design change in pump speed N and impeller diameter D. Used to predict the new pump head H for a design change in pump speed N and impeller diameter D. Used to predict the new pump power BHP for a design change in fluid, r, pump speed N and impeller diameter D. |
Example
It is desired to modify the operating conditions for the 38 in diameter impeller pump of Fig. 11.7b to a new pump speed of 900 rpm and a larger impeller diameter of 40 in. Determine the new pump head and power for the new pump speed at the BEP. |
|
For the D = 38 in impeller of Fig. 11.7b operating at 710 rpm, we read the best efficiency point (BEP) values as
Q* = 20,000 gpm, H* = 225 ft, BHP * = 1250 hp
Applying the similarity laws for N2 = 900 rpm and D2 = D1 = 38 in, we obtain
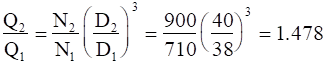
Q2 = 20,000*1.478 = 29,570 gpm ans.
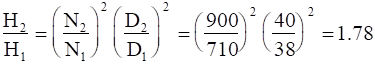
H2 = 225*1.78 = 400.5 ft ans.
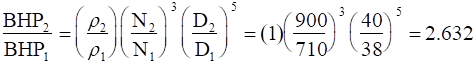
BHP2 = 3290 hp ans.
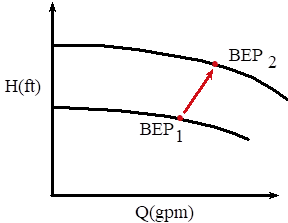
Thus, even small changes in the speed and size of a pump can result in significant changes in flow rate, head, and power.
It is noted that every point on the original 38 in diameter performance curve exhibits a similar translation to a new operating condition.
The similarity laws are obviously useful to predict changes in the performance characteristics of an existing pump or to estimate the performance of a modified pump design prior to the construction of a prototype.
Matching a Pump to System Characteristics
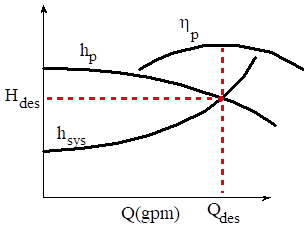
The typical design/sizing requirement for a pump is to select a pump which has a pump head which matches the required system head at the design/operating flow rate for the piping system.
Key Point |
hp = hsys at Qdes. |
It is noted that pump selection should occur such that the operating point of the selected pump should occur on the pump curve near or at the BEP.
From the energy equation in Ch. VI, the system head is typically expressed as
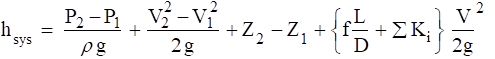
Thus, the selection of a pump for a |
|
Other operating and performance requirements (such as NPSH) and cost are obviously also a part of the selection criteria for a pump.
Source: http://www.eng.auburn.edu/~tplacek/courses/2610/samba/CHEN2610FacultyCh11b.doc
Web site to visit: http://www.eng.auburn.edu/~tplacek/
Author of the text: indicated on the source document of the above text
If you are the author of the text above and you not agree to share your knowledge for teaching, research, scholarship (for fair use as indicated in the United States copyrigh low) please send us an e-mail and we will remove your text quickly. Fair use is a limitation and exception to the exclusive right granted by copyright law to the author of a creative work. In United States copyright law, fair use is a doctrine that permits limited use of copyrighted material without acquiring permission from the rights holders. Examples of fair use include commentary, search engines, criticism, news reporting, research, teaching, library archiving and scholarship. It provides for the legal, unlicensed citation or incorporation of copyrighted material in another author's work under a four-factor balancing test. (source: http://en.wikipedia.org/wiki/Fair_use)
The information of medicine and health contained in the site are of a general nature and purpose which is purely informative and for this reason may not replace in any case, the council of a doctor or a qualified entity legally to the profession.
The texts are the property of their respective authors and we thank them for giving us the opportunity to share for free to students, teachers and users of the Web their texts will used only for illustrative educational and scientific purposes only.
All the information in our site are given for nonprofit educational purposes