
This model was born out of the Great Depression when it became obvious that markets were not operating efficiently, especially the labor market, and the Classic prescription was failing to bring the macroeconomy back to full employment. To appreciate the Keynesian model one must understand the major difference between long run and short run macroeconomics.
The main objective of long run macroeconomics has to do with increasing a nations capacity to produce, i.e., economic growth. The amount a society can produce, given that its resources are fully employed, is physically constrained the quantity and quality of its endowment of resources, as well as, the state of its technology. Economic growth results from overcoming these constraints through a process of investment increasing the amount of available resource, and also from development of newer and more efficient technology. Classical economist would suggest that the role of government in achieving these objectives would best be described as laissez-faire. The textbook makes this case in its discussion of the Classical Dichotomy - money is a veil, and government crowds out private sector economic activity. The main target for long run economic policy is potential GDP, the output available at full employment. The main policy is to keep it growing at a sustainable rate without incurring increasing inflation. We refer to this as the trend rate of growth of GDP (in economese this is termed the steady state growth rate).
Short run economics has a very different focus and set of objectives. It responds to a situation where resources are not always fully employed, an underlying assumption of long run economics. Furthermore, short run policy sees potential GDP as given and not as a target variable to be adjusted. Here the concern is to keep the macro economy as close to its trend rate of growth as possible. Typically, economic growth fluctuates around the trend rate of growth as the business cycle - boom followed by recession, etc. Short run macroeconomic policy is geared towards reducing the amplitude and frequency of the business cycle.
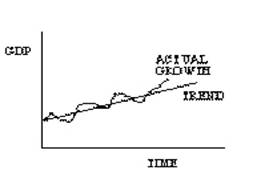
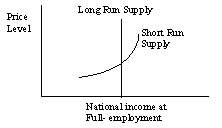
The distinction between long and short run economics is portrayed in the following graph. The vertical axis measure GDP or some other measure of macroeconomic performance and the horizontal axis measures time. The slope of the trend line describes the growth rate of GDP and is the target of long run economic policy. The economy’s actual growth path fluctuates around the trend. The goal of short run policy is to minimize deviation from the trend.
The controversy which exists between the Classical and Keynesian schools of thought centers on the government’s role in achieving macroeconomic policy goals. The Classicists are adamant that government is incapable in controlling or adjusting the macroeconomic environment, whereas, "hardcore" Keynesians would suggest that government can "fine tune" the macroenviroment. The truth, in my opinion, lies somewhere inbetween, probably somewhat closer to the Classicist’s point of view.
The Keynesian Model:
As noted above, the Keynesian model takes the economy’s ability to produce as a given. Thus deviations from potential GDP do not emanate from its production ability (supply side) but centers on the economy’s willingness to purchase what is produced (demand side). Thus recessions result from insufficient demand whereas; inflationary periods are a consequent of too much demand. In short the role of government is to moderate aggregate demand. The major question revolves around the government’s ability to manage aggregate demand in a timely and accurate manner.
Formally, the Keynesian model is made up of three types of equations and two types of variables. The equations are: identities - definitional in nature; behavioral - making assumptions about the behavior of specific sectors of the economy; and, equilibrium - the definition of equilibrium. The two types of variables are: endogenous whose values are determined by the model; and, exogenous whose values are given to the model. The distinction between endogenous and exogenous variables depends upon the complexity of the model. For our purposes, we will derive a very simple Keynesian model and the level of exogeniety will be correspondingly high. Models such as the DRI macro model consists of thousands of equations, each of which lowers the level of exogeniety.
Aggregate Demand:
We start the model with a definition and the national income accounting identity.
Define expenditures (E) as aggregate demand (AD) at constant prices. Then expenditures equals the sum of consumption C, investment (I), government spending (G), and net exports (X-Im).
1). E = C + I + G + X - Im
Of these variables, G and X will be considered to be exogenous. Government spending is dependent on a political process, whereas, exports will depend upon the expenditure behavior of other countries. These assumptions, of course, are not completely realistic and are endogenized in more complex models, but for our purposes do not detract from our objectives.
Consumption, investment and imports depend on the economic behavior of households and firms. Consumption which accounts for approximately two-thirds of our economy is modeled here as a simple Keynesian consumption function. Consumption is made up of two components. The first, induced consumption, depends on disposable income. The second is a gross simplification termed autonomous consumption which embeds all other factors influencing consumption other than income.
As income changes, so does consumption. The marginal propensity to consume (MPC) is defined as the proportion of the additional dollar of disposable income consumed. Since the additional dollar of income can either be consumed or saved the remaining proportion is saved and is termed the marginal propensity to save (MPS). Since these proportions exhaust all possibilities, they must sum to one. The following equation describes this consumption function. The right hand side it is divided into two terms: A being autonomous consumption; and, mpc(Y - tY) being induced consumption. The (Y - tY) term is simply an expression of disposable income which is defined as national income Y less tax revenue. Tax revenue is the tax rate, t, times national income.
2) C = A + mpc (Y - tY) = A + mpc(1-t)Y
For clarification purposes the student should be aware that: mpc = MC/MY & 1 > mpc >0 & mpc + mps =1.
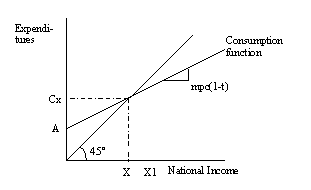
We graph this consumption function in expenditure/income space. The 45E ray has no particular economic meaning, but is useful because any point on it, as measured from the origin, has a height equal to its length. For example where the consumption function intersect the 45E ray, Cx, the level of consumption ,measured on the vertical axis, is equal to income X measured on the horizontal axis. X is called the break even level of income since there is no savings or dissavings. Savings occur at income levels greater than X, for example X1. The level of consumption is measured as the height of the consumption function at X1. But the height of the 45E ray at X1 is equal to the length of X1, consequently it also is a measure of X1 income. Since the 45E ray is higher than the consumption function at X1 not all income is being consumed and the vertical height between the two represents savings. Savings is positive where the 45E is higher than the consumption function and negative, i.e., dissaving, where the reverse is true at income levels below X.
The slope of the consumption function, mpc(1-t), takes a value of less than one. Since mpc and t are proportions between 0 and 1, their product must also be between 0 and 1. Of course as mpc approaches 1 and t approaches 0, the slope of the consumption function becomes steeper approaching the slope of the 45E line. This will be important later when discussing exogenous changes in expenditures.
Autonomous consumption, term A, is a catch all which in more complete models becomes extremely complex. In essence, it is that part of consumption which is independent of income. Imbedded in this term are wealth, expectations, exchange rates, and interest rates just to name a few of the many other factors influencing consumption levels. Of note is wealth, or more precisely real wealth. Recall that this model is predicated on the notion of constant prices. Much of the nations stock of wealth is denominated in dollar terms and is consequently sensitive to the price level. As prices rise, the purchasing power of the stock of wealth declines, or in other words, real wealth declines. The consequence of this is a decrease in autonomous consumption and the consumption function shifts downwards resulting in a decrease in total expenditures. This is what the book refers to as the Pigou Wealth effect. This is one of the reasons given for aggregate demand’s downward slope. More topically is the wealth effect due to the volatility of the equities market. As the Dow Jones continues to rise consumer confidence remains steady, but a major market correction could lead to a sharp decrease in consumption and have a dampening effect on the economy.
The second behavioral equation models investment decision making. Among a variety of other factors, investment is thought to be sensitive to real interest rates. Using the same simplification as we did for consumption we can model investment as having two components, one part sensitive to real interest rates and the other being autonomous. The main difference here is that we will assume for simplicity’s sake that investment is independent of national income. This is patently false. There is induced investment, but this adds a level of complexity that we will avoid. The third equation of our model is given as:
3) I = V - bi,
where V is autonomous investment (autonomous of the interest rate) and the second term -bi represents interest rate sensitive investment. The term b is a parameter measuring the responsiveness of investment to interest rate changes. Note the negative sign depicting a negative relationship between the two.
Since, investment is independent of income; it is depicted in our diagram as a horizontal line. Changes in either autonomous investment or the interest rate shift the line up or down. Monetary policy and other changes to the credit market have their impact on the macroeconomy via interest rate changes effecting investment.
This avenue provides for the Keynesian interest rate effect, a contributing explanation for the aggregate demand curve’s downward slope. The basic notion is that as prices rise so will the demand for cash to maintain available purchasing power. This increase in demand in turn leads to a higher interest rate depressing interest rate sensitive expenditures such as investment.
Returning to the diagram, total expenditures, depicted as Exp, equals the vertical sum of consumption and investment. Note that its slope is identical to that of the consumption function.
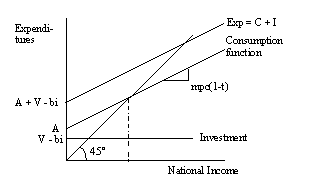
The third component of expenditures is government spending. In the absence of a balanced budget amendment spending is independent of income. Under this condition, G depending solely on the political process is considered exogenous. Consequently, it too is a horizontal line in our diagram. I am going to hold off including it in our diagram until we have developed net exports.
Net exports (exports minus imports) are a little more complicated than G or I. The common conceptualization of imports depicts them as being sensitive to income levels. As national income rises so will the demand for imports. Exports, on the other hand, being solely dependent on foreign income are treated as exogenous. The following set of equations captures these assumptions and relationships.
4) net exports NX = X - (Aim + mpi*Y), where
a) Imports: Im = Aim + mpi*Y
b) Exports: X=X
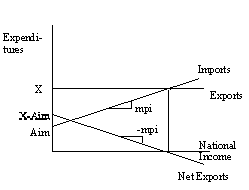
In the net exports and imports equations Aim represent autonomous imports and mpi is the marginal propensity to import. As income rises, some proportion of the additional dollar is spent on imports. This concept is identical to mpc. In fact it is the portion of mpc spent on imports. Graphically, exports, being independent of national income, are portrayed as a horizontal line. Imports, being a positive function of income, are portrayed as an upward sloping line, with Aim as the intercept and with mpi as its slope. Net exports are the vertical difference between exports and imports. It intersects the vertical axis at X-Aim; its slope is negative mpi; and, it intersects the horizontal axis where exports equal imports. The Mundell-Fleming effect, alluded to in your book, refers to this model of net exports. As domestic prices rise relative to foreign prices, the relative price of domestic goods increase on world markets (holding exchange rates constant). This would depress exports, while simultaneously increasing autonomous imports. This would be portrayed as a downward shift in exports, an upward shift in imports, resulting in a downward shift in net exports. This is another reason given by the text for aggregate demand’s downward slope.
We can now finish the framework for the Keynesian Aggregate demand.
Expenditures equals the sum of C, I, G, and NX. Incorporating these together gives the following graph.
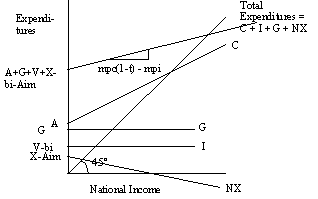
The total expenditure line’s intercept is the sum of all expenditures independent of income. Its slope combines the slopes of the consumption function and import functions slope, the only ones dependent on income levels.
The last demand side equation of the Keynesian model is an equilibrium equation. Equilibrium is defined as national income equaling expenditures. Recall that investment, by national income accounting methods, includes inventories. The distinction needs to be made between planned and unplanned investment. Should expenditures fall short of national income, then all that is being produced is not being purchased. Consequently, unplanned inventories begin to pile up, leading firms to cut back production decreasing national income bringing it in line with expenditures. Conversely, should expenditures exceed national income, then firms see a quick depletion of their inventories, stimulating them to increase production, and thus, national income. In our graph then, equilibrium occurs at the intersection of the expenditure function and the 45E line, where expenditures equal national income.
This now lays the foundation for a Keynesian analysis of fiscal and monetary policy.
Fiscal policy, the government’s tax and spend programs, are imbedded in the model in the G and t terms. We will focus on the spending side of fiscal policy since it is easier to portray its effects. Monetary policy has already been discussed in class. The Fed, through its imperfect control over the money supply, can adjust interest rates. This in turn effects investment and other interest rate sensitive expenditure.
The government, then either through fiscal or monetary policy, directly or indirectly brings about a change in autonomous expenditures. This will shift the expenditure function up or down, depending if policy in expansionary or contractionary, respectively. This in turn will eventually lead to a new macroeconomic equilibrium. This is best seen using our diagram.
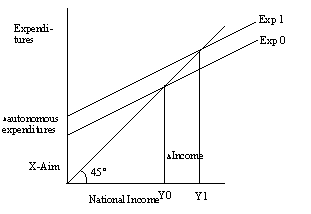
Suppose an increase in G raises expenditures from Exp0 to Exp1. The equilibrium level of income rises from Y0 to Y1. Note that the change in income is greater than the change in autonomous expenditures. The reason for this is the Keynesian multiplier. Before explaining the multiplier, the student should note that the steeper the expenditure function the greater is the multiplier’s effect. This means that a given increase in autonomous expenditures brings about a greater increase in national income. Prove this by drawing it out.
The underlying mechanism for the Keynesian multiplier is induced consumption. The initial stimulus, in this case an increase in government spending, generates income to the owners of the resources used in producing whatever it was that the government bought. They in turn, with the consequent increase in their income, increase their consumption. This leads to an increase in income to whoever supplied them with consumption goods. Eventually, this expenditure creating new income process comes to an end. With each iteration, the amount of income generated decreases. We have three leakages present in our model: savings, taxes, and expenditures on imports, all of which are involved in the slope of the expenditure function.
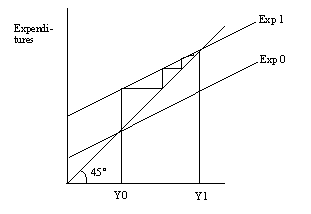
We can visualize this process by taking a closer look at our diagram. The graph recreates the portion of the previous diagram where the expenditure function and 45E line is bounded by Y0 and Y1. This resembles a staircase. The riser and the tread of first step (to the right of Y0) represent the increase in autonomous expenditures and the income it generated, respectively. The subsequent steps represent induced consumption and the income it generates.
The algebraic solution to the model is obtained by substituting respective equations into the national income accounting identity. Imposing the equilibrium condition we set expenditures equal to national income. We can now solve for the equilibrium level of income.
Y = [ A + mpc(1-t)Y ] + [ V - bi ] + [ G ] + [ X - Aim -mpiY ]
Collecting exogenous terms and factoring out Y we get,
Y = [A+V-bi+G+X-Aim] + [mpc(1-t)-mpi]Y. Solving for Y gives the following,
Y = {1/ (1-[mpc(1-t)-mpi])} * [A+V-bi+G+X-Aim] .
The first term on the right hand side, {1/ (1-[mpc(1-t)-mpi])}, is the mathematical expression for our model’s Keynesian multiplier. Since the multiplier involves induced consumption, any leakage will diminish it. To verify, increase the size of any leakage and see what happens to the size of the multiplier. Accepted values for these terms are mpc=0.9, t=0.25, & mpi=0.2 giving a value to the multiplier of approximately 1.90. Increase the values for either t or mpi, or decrease mpc. A note of caution is in order - be careful in your calculations. Meticulously pay attention to the brackets in the formula.
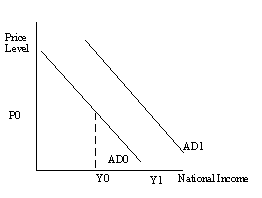
Plotting shifts of the expenditure function in price level/national income space gives rise to the aggregate demand curve. As previously noted, an increase in the price level impacts the expenditure function via three avenues: Pigou’s wealth effect by changing autonomous consumption; the Keynesian interest rate effect, whereby the demand for money rises increasing the interest rate depressing investment; and, the Mundell-Fleming effect where net exports shift towards foreign produced goods. All of these give rise to aggregate demand’s negative slope. Any other change in expenditures is predicated on a set of constant prices. Thus, for example should government expenditures rise, the aggregate demand curve would shift horizontally to the right changing national income by the amount of the initial change in expenditures times the Keynesian multiplier as previously derived.
Fiscal and monetary policy through its effects on expenditures results in the shifting of the aggregate demand curve. These policies in this context are called demand management. To determine more precisely the effect of these policies on the macroeconomy we must now focus our attention to aggregate supply.
Aggregate supply:
We will not be deriving the aggregate supply curve in any great detail. I will rely heavily on the book’s presentation for several of its characteristics, namely the presentation of its slope and what causes it to shift.
With regards to the slope of the short run aggregate supply, the three avenues discussed in the book: The New Classical Misperceptions Theory; Keynesian Sticky Wage Theory; and, the New Keynesian Sticky-Price Theory are fairly straight forward. In each of these cases people have misperception about changes in the price level or are locked into a situation where they cannot adjust to price level changes. The short run supply curve shifts once adjustments are made. We revert to a long run on the vertical long run supply curve at full employment.
One short run aggregate supply shifter which is not well developed in the book is the effect of a change in the cost structure of production. Rising input prices, leading to increased costs, causes a decrease in aggregate supply, shifting it to the left. This leads to a situation called stagflation which occurred in the aftermath of the oil price shocks of the mid to late seventies. It is important to be aware of this effect, both in terms of increasing or decreasing cost structures, for it is the driving force underlying the macroeconomy’s self correcting mechanism discussed below.
One further issue with respect to short run aggregate supply that the book does not explicitly discuss is its shape. These supply curves are non-linear. Using the full-employment long run supply curve as a benchmark we can motivate the reasoning for the shape of the short run supply curve. Recall that full-employment is defined as the level of GDP where the level of unemployment is at its natural rate of unemployment (the going level of frictional unemployment). Output levels below this would reflect a recession and those above would be consistent with an overheated economy experiencing inflationary pressures. The shape of the short run supply curve responds to which situation the economy finds itself. At low levels of output the economy, experiencing recession, is characterized by a slack labor market. Increased demand for output can be satisfied by hiring idle resources without an upward pressure on prices. Thus, the short run aggregate supply curve would be relatively flat.
Conversely, at levels of output higher than full-employment labor markets are extremely tight with resource utilization approaching its physical constraints. At this point increases in the price level will not generate much additional output. In this case, the short run supply curve will be relatively steep. The graph depicts these relationships.
Aggregate Demand and Supply:
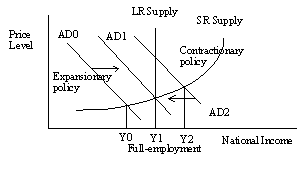
We can now examine more fully the behavior of the macroeconomy, as well as, government attempts to adjust aggregate demand. Short run equilibrium in the macroeconomy occurs when aggregate demand equals aggregate supply. This, depicted as the intersection of the two, can occur anywhere along the short run supply curve. This gives rise to short run deviations from full-employment resulting in either a recession or an inflationary overheated economy. In the former , the government could enact expansionary policy in an attempt to shift the aggregate demand curve to the right towards full employment lessening the severity of the recession. In the presence of an overheated economy, government policy would be the reverse, contracting the economy again towards full employment.
Recall that the effects of these policies will be magnified by the multiplier effect. In the diagram the equilibrium at Y0 depicts a recession, whereas the Y1 equilibrium is consistent with an inflationary period. Fiscal and monetary policy would then be used to shift aggregate demand to AD1 bringing the economy back to full employment.
At least, that is the theory behind Keynesian economics. The main questions to be asked are:
1) How effective is the government in achieving its objectives?
2) How long would a short-run equilibrium inconsistent with full employment last in the absence of government intervention?
The answer to these questions tends to be highly politicized. What follows are my assessments although counter arguments can be made with equal validity.
First, the effectiveness of government policy - fiscal policy being a political process is ineffectual and possibly harmful if used to this end. The main reason for this is that timing is extremely important. Enacting the process for expansionary fiscal policy once an economic downturn is perceived usually results in it becoming effective once the economy corrects itself. This would stimulate the economy at full employment leading to a possible inflation. The political lag in enacting policy makes fiscal policy dangerous. Monetary policy, in my opinion, proves to be more successful. The Board of Governors, being an independent entity, can and does respond quickly to changes in the economy. However, critics suggest that the time it takes for its policy to become effective, i.e., the time it takes for interest rate sensitive expenditures to respond to changes in the interest rate, presents the same problems as fiscal policy. Personally, I disagree. While business investment may not respond quickly, consumer expenditures for durable goods and for housing are quick to respond. Furthermore, Fed policy has a tremendous effect on equity markets leading to wealth effects akin to Pigou’s Wealth effect. Causal empiricism reveals that the economy’s reaction to Fed policy tends to be quick and substantial.
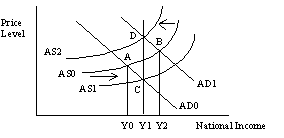
The second question dealing with the economy’s ability to self correct requires a discussion as to how this mechanism works. The primary force which underlies the self correcting mechanism is derived from a change in the cost structure of the economy leading to a shift of the short run supply curve. In the case of a recession, high unemployment would eventually result in the lowering of the real wage rate. With more applicants than vacancies, the price of labor would fall eliminating surplus labor in the form of unemployment. This in turn would lead to an increase in aggregate supply leading the macroeconomy back to full employment at a lower the price level. The main controversy is how long this process takes. Keynesians would argue that this process is lengthy and in the immortal words of John Maynard himself, "in the long run we are all dead." Classicists would disagree over the length of time required to complete the process. I would argue that advances in communications technology leading to quick dissemination of information reduce the length of the long run. However, if the cost of unemployment is sufficiently high, then why not speed up the process with government intervention.
The self-correcting mechanism in the case of an overheated economy is the converse. Here cost structures rise leading of a decrease in aggregate supply resulting in an economic slowdown but at a higher price level. In essence, the economy has inflated its way out. This would be a quicker process then the deflation of a recession. Here I would argue that the government again step in and contract the economy in order to avoid the inflation.
The diagram demonstrates the self correction for both a recession and an inflationary economy. In the former case, a short run equilibrium occurs at point A at the intersection of AD0 and AS0. The resulting national income, Y0, falls below full-employment income of Y1. Over the course of time labor adjusts its expectations with respect to the wage rate, accepting lower real wages reducing the costs of production. This causes the aggregate supply curve to increase to AS1 achieving a new equilibrium at full employment, Y1 at a lower price level than originally. Conversely, should the economy find itself at point B, at the intersection of AS0 and AD1, then inflationary pressures are high since national income, Y2, exceeds full employment. A wage price spiral leads to increased costs of production causing a decrease in aggregate supply to AS2. The new equilibrium again occurs at Y1, but the price level has increased.
Source: http://www.usi.edu/business/cashel/209/Keynesian%20Macromodel.doc
Web site to visit: http://www.usi.edu/
Author of the text: indicated on the source document of the above text
If you are the author of the text above and you not agree to share your knowledge for teaching, research, scholarship (for fair use as indicated in the United States copyrigh low) please send us an e-mail and we will remove your text quickly. Fair use is a limitation and exception to the exclusive right granted by copyright law to the author of a creative work. In United States copyright law, fair use is a doctrine that permits limited use of copyrighted material without acquiring permission from the rights holders. Examples of fair use include commentary, search engines, criticism, news reporting, research, teaching, library archiving and scholarship. It provides for the legal, unlicensed citation or incorporation of copyrighted material in another author's work under a four-factor balancing test. (source: http://en.wikipedia.org/wiki/Fair_use)
The information of medicine and health contained in the site are of a general nature and purpose which is purely informative and for this reason may not replace in any case, the council of a doctor or a qualified entity legally to the profession.
The texts are the property of their respective authors and we thank them for giving us the opportunity to share for free to students, teachers and users of the Web their texts will used only for illustrative educational and scientific purposes only.
All the information in our site are given for nonprofit educational purposes