Try This Yourself: |
|
Open File |
Before starting this exercise you MUST open the file E1317 Charting_1.xlsx… |
|
Click in cell A3, hold down |
|
Click on the INSERT tab, then click on Recommended Charts in the Charts group |
|
Click on each of the alternatives in the left pane to see a preview of how the chart will appear in the right pane and spend a few moments reading the descriptions |
|
Click on Line chart (the second alternative in the left pane), then click on [OK] to embed the chart in the worksheet |
|
Point to the top border of the chart, then click and drag the chart immediately below the data |
|
Click in cell A1 to deselect the chart |
selected data and presents you with what it considers to be the best way to chart that data. Several alternatives are presented and you simply choose the one you like most.
![]()

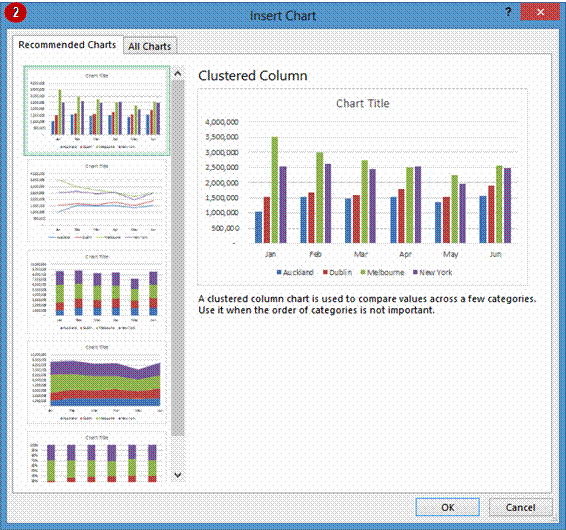

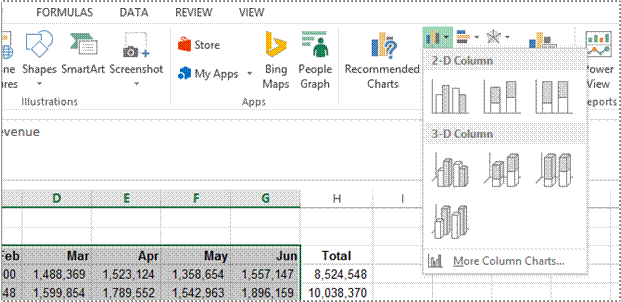
The easiest way to create a chart is by using the Recommended Chart feature. However, you can create a chart yourself from scratch using
INSERT tab of the ribbon. This may be faster if you have a specific style of chart in mind.
![]()
![]()
![]()
Try This Yourself: |
|
Open File |
Before starting this exercise you MUST open the file E1317 Charting_1.xlsx… |
|
Click in cell A3, hold down |
|
Click on the INSERT tab, then click on Insert Column Chart in the Charts group to see a gallery of Column chart types |
|
Under 2-D Column, click on Clustered Column |
|
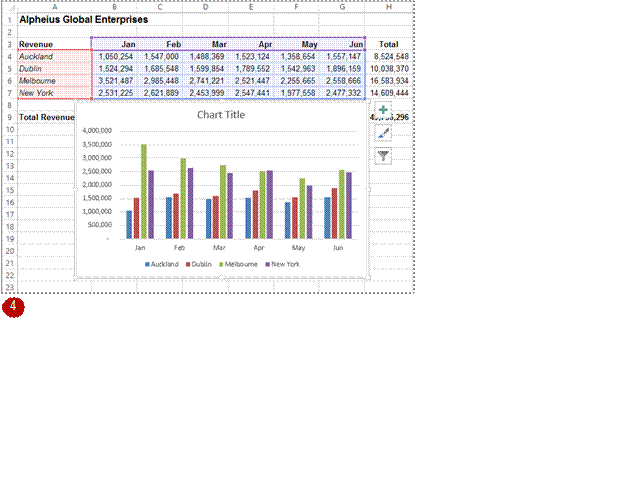
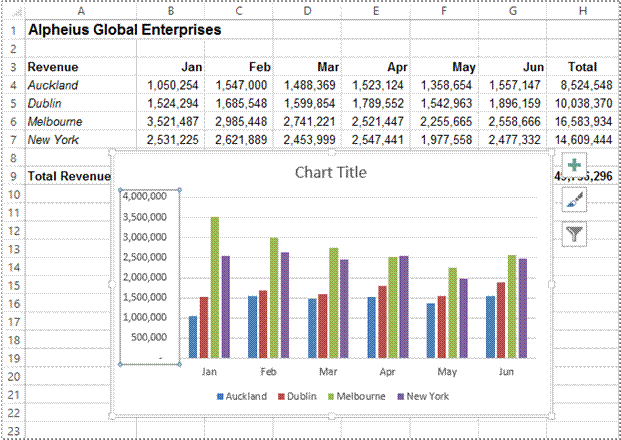
Point to the chart, then click to select it and drag the chart so that it is underneath the data, as shown |
|
Click in cell A1 to deselect the chart |

By default, new charts are placed in the active worksheet, which is usually the one that contains the data. Charts are placed over the top of the worksheet, embedded as objects. When you
want to work with a chart you must select it – this can be done by clicking on the chart. The chart itself is made up of many objects and these too can be selected by clicking on them.
![]()
Try This Yourself: |
|
Same File |
Continue using the previous file with this exercise, or open the file E1317 Charting_2.xlsx... |
|
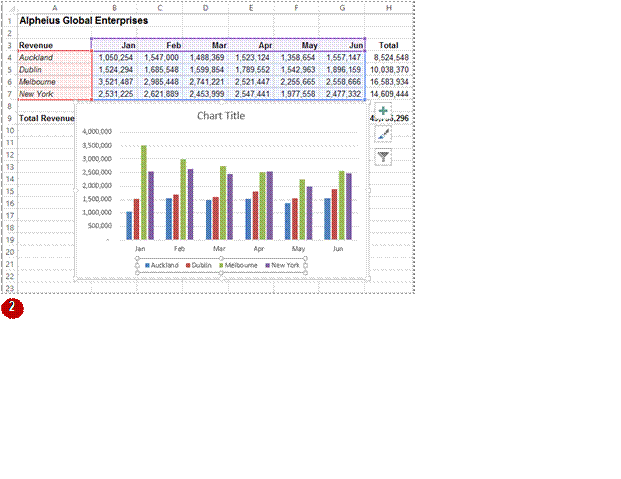
Point to the border of the chart and click once to select the chart as an object |
|
Click on the chart legend to make it the active object in the chart |
|
Click on the vertical axis |
|
Click on the horizontal axis to make it the active object |
|
Click on the border of the chart to make the overall chart the active object again – notice that the range of data has been coloured again |
|
Click in cell A1 to deselect the chart |

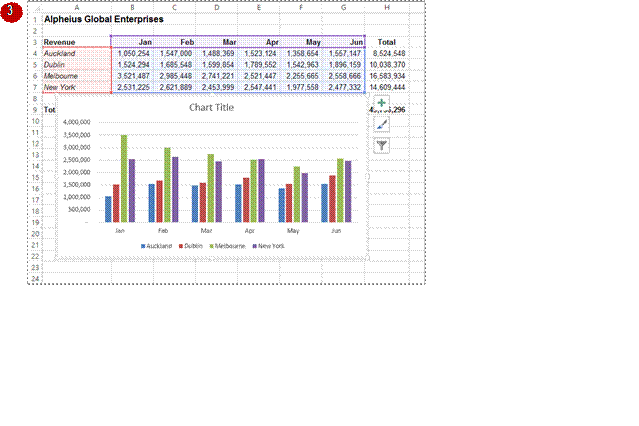
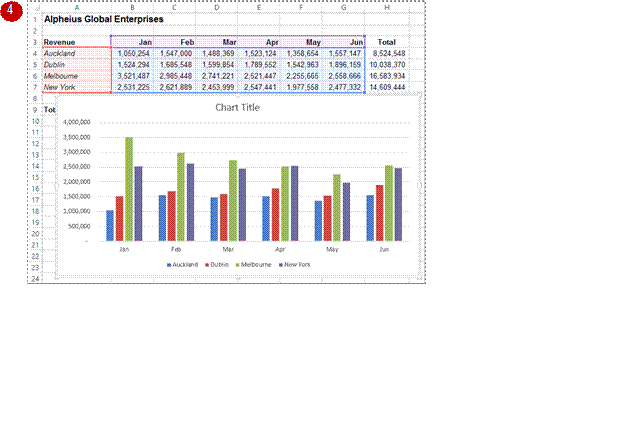
There are two main ways to resize a chart if you are not satisfied with its current size. A chart that has been selected can be resized by dragging one of the sizing handles around its border.
These handles appear with dots in them. You can also resize a chart using commands in the Size group on the CHART TOOLS: FORMAT tab that appears when the chart is selected.
Try This Yourself: |
|
Same File |
Continue using the previous file with this exercise, or open the file E1317 Charting_3.xlsx... |
|
Click on the chart to select it |
|
Point to the sizing handle on the left border of the chart until the mouse pointer changes to a double arrow |
|
Hold down the left mouse button and drag left until the chart appears as shown |
|
Click on the CHART TOOLS: FORMAT tab |
|
Click on the up spinner arrow for Shape Height in the Size group until it shows 8.5 cm |
|
Click on the up spinner arrow for Shape Width in the Size group until it shows 17 cm |
|
Click in cell A1 to deselect the chart |

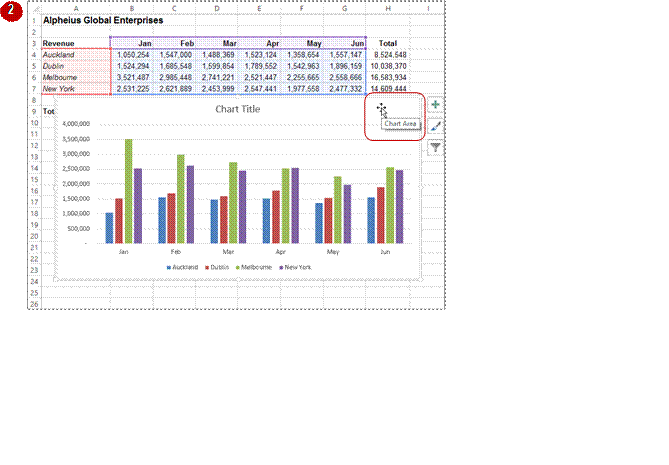
It’s unlikely that a chart embedded in the worksheet by Excel will be exactly where you would like it to be. You can easily relocate a chart to a more appropriate position by clicking
on and dragging the border of the chart to the desired location. The chart obviously must be selected before it can be dragged to a new position.
Try This Yourself: |
|
Same File |
Continue using the previous file with this exercise, or open the file E1317 Charting_4.xlsx... |
|
Click on the chart to select it |
|
Point to the border of the chart until the mouse pointer changes to a four- headed arrow |
|
Hold down the left mouse button and drag the chart below the data so that the Total Revenue row in the worksheet is visible |
|
Click in cell A1 to deselect the chart |

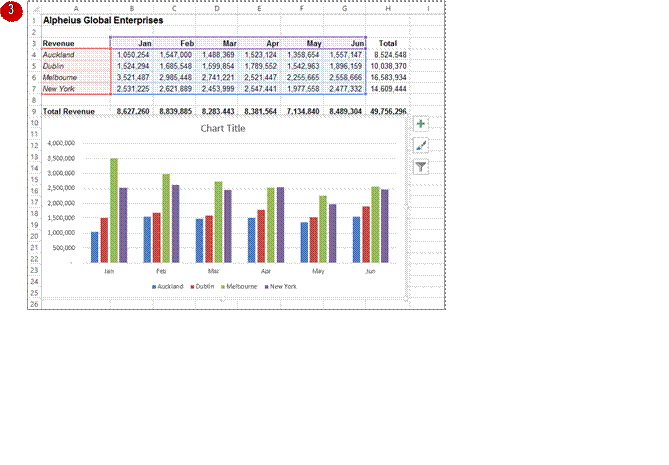
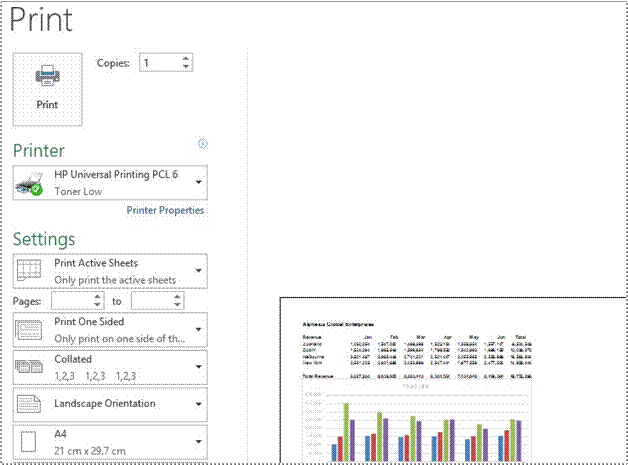
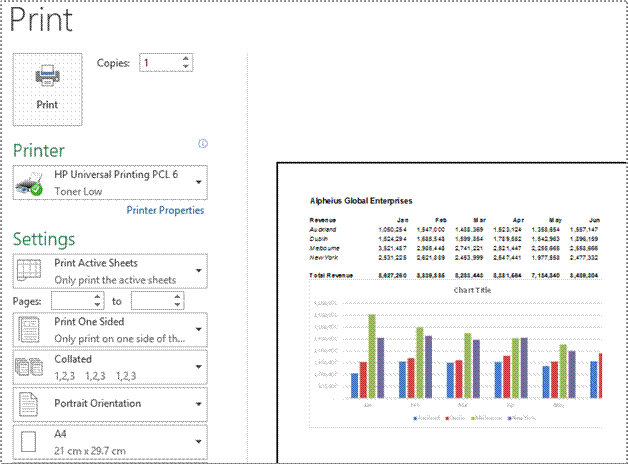
When you print a worksheet, Excel will print whatever is in or embedded in that worksheet (including charts). This makes it easy and convenient to print both the chart and its
underlying data. All you need to do is to position the chart in the appropriate location then access the print commands in the usual way.
![]()

Source: https://www.sgul.ac.uk/about/our-professional-services/information-services/library/documents/training-manuals/Excel-Fundamentals-Manual.pdf
Web site to visit: https://www.sgul.ac.uk
Author of the text: indicated on the source document of the above text
If you are the author of the text above and you not agree to share your knowledge for teaching, research, scholarship (for fair use as indicated in the United States copyrigh low) please send us an e-mail and we will remove your text quickly. Fair use is a limitation and exception to the exclusive right granted by copyright law to the author of a creative work. In United States copyright law, fair use is a doctrine that permits limited use of copyrighted material without acquiring permission from the rights holders. Examples of fair use include commentary, search engines, criticism, news reporting, research, teaching, library archiving and scholarship. It provides for the legal, unlicensed citation or incorporation of copyrighted material in another author's work under a four-factor balancing test. (source: http://en.wikipedia.org/wiki/Fair_use)
The information of medicine and health contained in the site are of a general nature and purpose which is purely informative and for this reason may not replace in any case, the council of a doctor or a qualified entity legally to the profession.
The texts are the property of their respective authors and we thank them for giving us the opportunity to share for free to students, teachers and users of the Web their texts will used only for illustrative educational and scientific purposes only.
All the information in our site are given for nonprofit educational purposes