Prof. dr. sc. D. Bajić
Key words: longitudinal turning process, surface roughness, cutting parameters, mathematical modelling, optimization
Turning influence of cutting parameters
ABSTRACT
The objective of this study was to investigate influence of cutting parameters on the surface roughness, during the longitudinal turning process. Detailed experiments according to the factors test plan and regression analysis, gave the extend equation for mean arithmetical roughness, as one of the most useful signs of the surface roughness. In other to get a minimum values of the surface roughness, optimization of the mathematical model is done by and optimal values of the examined factors are determined.
The obtained results are, according to the experiment plan, valid for the testing of material Č5431 (DIN 34CrNiMo6). The test results are to be probably applied to other materials, however, has to be proved for each separate case.
1. INTRODUCTION
The development of new technologies, building and introduction of numerically controlled machine tools i.e. machine systems have significantly changed conditions and relation within production. The lack of reliable technological bases, necessary for machining systems programming, causes significant troubles for the successful exploitation of the present machining systems. There exists a misconception that in the present time of electronic computers it is not necessary to be well familiar with chip-forming machining, considering it obsolete. However, just under new conditions it is necessary to obtain new knowledge about regularities in chip forming machining, about cutting features of new, highly-productive tools, about machinability of workpiece material and so on. High reliability and efficiency which is required from modern machining systems directly depend upon the reliability of input data such as: material machinability, patterns of tool wear, optimal operating parameters, finished surface unevenness, chip formation of adequate size and so on. Due to this, research in this field is of great importance and highly developed countries invest lot o money in it.
Surface roughness has a significant influence on exploitation characteristics of the part that carries the above-mentioned surface. Surface finish defined as average of mean deviation of the profile from the mean line, is important for tribologic behavior of workpieces in working conditions. On the other hand, an increased depth of surface roughness has a negative effect on dynamically loaded parts because of their notch impact that can cause a rupture of the part. Thus a knowledge of interdependence between depth of surface roughness and an average of mean deviation of the profile from the line is needed.
2. FACTORS THAT INFLUENCE SURFACE ROUGHNESS
The roughness of the machined surface is seen through micro-geometrical irregularities of the surface. The evaluation of the quality of machined surface is based on the judgment of its roughness. Theoretical roughness depends exclusively on tools geometry and applied process of machining whereas a real roughness appears as the result of theoretical roughness though with bigger or lesser occasional roughness provoked by the many factors. The surface roughness is influenced by the most important factors such as:
Cutting speed influence is associated to generation of build-up edge i.e. build-up edge’s influence on surface roughness of processed surface. At lower cutting speed (0,16-0,6 [m/s]), generation of build-up edge results with grater surface roughness.
Increment of cutting speed results causes decrement of build-up edge influence that induces as reduction of surface roughness. With further increment of cutting speed, nature of particles separation changes, what results as decrement of plastic deformation causing surface roughness reduction. Unlimited increment of cutting speed doesn’t influence roughness because it causes greater tool wear that keeps surface roughness approximately on the same level.
Feed influences surface roughness directly proportional. Feed increment results as increment of surface roughness. However feed influence is related to cutting tool nose radius influence. Unlimited reduction of feed does not result with reduction of surface roughness. At some level, value of cutting tool nose radius prevents further reduction of surface roughness causing it to stay at minimum possible level.
Cutting tool nose radius influences surface roughness inversely proportional. Increment of cutting tool nose radius value causes reduction of surface roughness. Reduction of surface roughness is limited with some minimal value. Further increment of cutting tool nose radius value causes vibrations that have negative influence in surface roughness.
From geometrical perspective, the depth of cut doesn’t influence surface roughness because it has no influence on size and form of bumps. However, influence of depth of cut is indirect trough generation of build-up edge, deformation of separated particles, cutting temperature, cutting forces, vibrations etc.
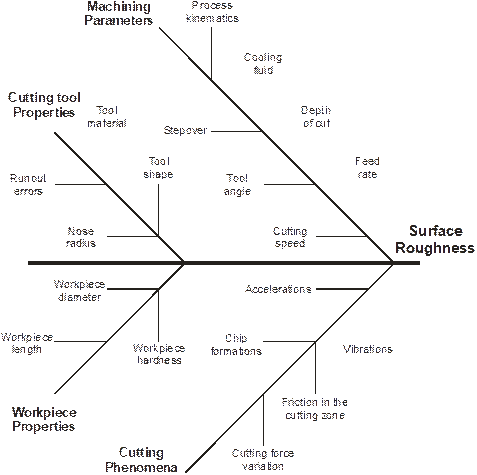
Figure 1 shows influential factors on surface roughness regarding chip-forming machining.

Figure 1. – Fishbone diagram with the factors that affect surface roughness
Experiment aim is to define adequate mathematical model that is used to determine the influence of independent factors and cutting data, at surface roughness. The following independent factors are selected: cutting speed (vc), depth of cut (ap), and feed (f). For a concrete case, that means determination of criteria:
– surface roughness: Ra = f(vc, ap, f).
Experiments are performed on lathe machine “PRVOMAJSKA” D-420/1500. Workpiece material is steel 34CrNiMo6 (DIN). The experiments are carried out by the tool for external machining, which consists of toolholder mark PTGNR 2020K 16 and insert mark TNMG 160408-PF4015. The “SURTRONIC 3” instrument, produced by Rank Taylor Hobsen, has done the measurements of surface roughness. The multifactor design of the second degree has been used to carry out this experiment. Actually, in order to learn more about the maximum or minimum of the process or its function it is necessary to approximate it by the polynomial of the second rather than the polynomial of the first degree.
The selected values of the cutting parameters are the following:
– cutting speed: vc,max = 2,0525[m/s]
vc,min = 0,821[m/s]
– depth of cutt: ap,max = 1,2 [mm]
ap,min = 0,6 [mm]
– feed: fmax = 0,28 [mm/r]
fmin = 0,16[mm/r].
Central composite design with empiric polynomial model of the second degree is taken:
![]() (1)
(1)
–- b0, bi, bij, bii – regression coefficient,
– x – coded values of input parameters.
In order to get regression equation determined by polynomial of the second degree using the statistics analysis, it is necessary to expand the design matrix with some other physic factor values or rather to increase the number of experimental points which is to get by rotatability character. Rotatability can be selected by an appropriate choice of coefficient, marked by aavalue of which depends upon the number of the points of factorial design. For k=3 the given value of aa= 1,682. The needed experimental points number, as far as the design of the second degree is concerned, figure out the following:
![]() (2)
(2)
2k – the design number within the basic points
n0 – the repeated design number of the average level, n0 = 6
na – the design number on the central axes, na = 6
Adding the points to the central axes where xi = ±aa, and aa= 1,682, the 3-factorial design can be presented in Table 1.
Table 1. – Physic values and coded indexes of input factors
Input factors |
Coded values of input factors |
|||||
x-ia |
x-i,min |
x-i0 |
xi,max |
x+ia |
|
|
-1,682 |
-1 |
0 |
+1 |
+1,682 |
|
|
x1 = vc [m/s] |
0,401 |
0,821 |
1,4367 |
2,0525 |
2,4724 |
|
x2 = ap [mm] |
0,4 |
0,6 |
0,9 |
1,2 |
1,4 |
|
x3 = f [mm/r] |
0,12 |
0,16 |
0,22 |
0,28 |
0,32 |
|
Measured values of surface roughness, as the results of testing twenty experimental points defined by experiment plan matrix, are shown in Table 2. The mentioned values of surface roughness are input data for mathematical modeling of results, which was made by multiple regression analysis and by using program package “Design Expert 6”.
TEST NUMBER |
INPUT |
Measured values |
Calculated values |
||
vc [m/s] |
ap [mm] |
f [mm/r] |
|||
1 |
0,8210 |
0,6 |
0,16 |
4,10 |
4,16 |
2 |
2,0525 |
0,6 |
0,16 |
2,70 |
2,71 |
3 |
0,8210 |
1,2 |
0,16 |
3,55 |
3,58 |
4 |
2,0525 |
1,2 |
0,16 |
2,10 |
2,13 |
5 |
0,8210 |
0,6 |
0,28 |
5,10 |
5,16 |
6 |
2,0525 |
0,6 |
0,28 |
3,77 |
3,71 |
7 |
0,8210 |
1,2 |
0,28 |
5,30 |
5,37 |
8 |
2,0525 |
1,2 |
0,28 |
3,92 |
3,92 |
9 |
1,4367 |
0,9 |
0,22 |
3,78 |
3,78 |
10 |
1,4367 |
0,9 |
0,22 |
3,80 |
3,78 |
11 |
1,4367 |
0,9 |
0,22 |
3,81 |
3,78 |
12 |
1,4367 |
0,9 |
0,22 |
3,79 |
3,78 |
13 |
1,4367 |
0,9 |
0,22 |
3,78 |
3,78 |
14 |
1,4367 |
0,9 |
0,22 |
3,79 |
3,78 |
15 |
0,4010 |
0,9 |
0,22 |
5,87 |
5,75 |
16 |
2,4724 |
0,9 |
0,22 |
3,30 |
3,32 |
17 |
1,4367 |
0,4 |
0,22 |
3,55 |
3,55 |
18 |
1,4367 |
1,4 |
0,22 |
3,30 |
3,25 |
19 |
1,4367 |
0,9 |
0,12 |
2,49 |
2,42 |
20 |
1,4367 |
0,9 |
0,32 |
4,78 |
4,75 |
Regression analysis has shown which factors and interactions have had an important impact on the value of surface roughness. Applying repeated regression analysis the coefficient of regression, multi-regression factor, standard false evaluation and the value of t-test have been determined. Significant factors and interactions are as follows: vc, f, ap·f, vc2, ap2, f2, whereas non-significant ones are: ap, vc·ap, vc·f.
On the basis of the applied regression analysis, the dependence of an average arithmetic roughness Ra and examined factors can be expressed as:
![]() (3)
(3)
with regression coefficient: r2 = 0,9963.
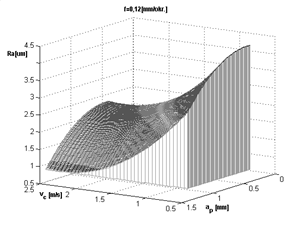
The analysis of obtained mathematical models and cutting data influence at surface roughness has been made using diagrams shown in Figures 2, 3, 4, 5, 6, and 7.
 Figure 2.- Surface roughness in dependence of cutting depth ap and cutting speed vc (fmin= 0,12 [mm/r]) |
|
|
|
|
|
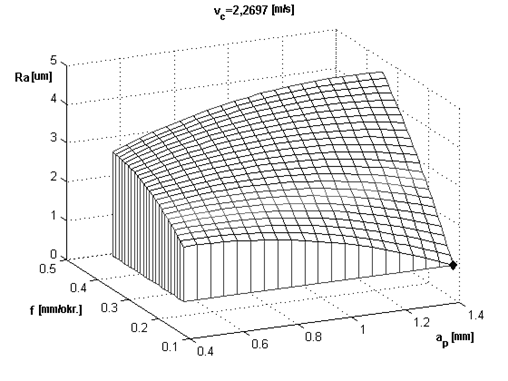
Given mathematical model (3), due to the applied regression analysis, is optimised the way that the model parameters such as: cutting speed, depth of cut and feed, assume the optimum values whereas the aim function, figured out through the average arithmetic roughness, gain the minimum value. The minimum aim function has been found out for the following cutting parameters:
vc,opt = 2,2697 [m/s]; ap,opt = 1,4 [mm]; fopt = 0,12 [mm/r]
for which the aim function or rather minimal value of the average arithmetic roughness is expressed as: Ra,min = 0,858 [µm] .

Figure 8.- Surface roughness in dependence of cutting depth ap and feed f
(vc, opt= 2,2697 [m/s])
Mathematical model presents quite well the performance of the average arithmetic roughness. However, it can be used as well for the evaluation of the surface roughness value in longitudinal turning work, whilst applying specific cutting parameters or as a useful model in selection of appropriate cutting parameters in order to achieve a specific demanding roughness.
Relating to the given equation and diagrams it is worth to point out the following conclusions:
[1] Cebalo, r.; BAJIĆ D.; BILIĆ, B.: Mathematical modelling of cutting forces in the longitudinal turning process, 10th International Scientific Conference on Production Engineering CIM 2005, Lumbarda, 2005., str. I 31-I 40.
[2] BENARDOS, P.G.; VOSNIAKOS, G.-C..: Predicting surface roughness in machining: a review, International Journal of Machine Tools & Manufacture, 43 (2003), 833-844.
[3] Bilić, B.; Bajić, D.; Veža, I.: Optimization of cutting parameters regarding surface roughness during longitudinal turning, 15th International DAAAM Symposium: Intelligent Manufacturing & Automation: Globalisation – Technology – Men - Nature, Vienna, 2004., str. 039-040.
[4] CEBALO, R.: Ovisnost dubine hrapavosti o srednjoj aritmetičkoj hrapavosti brušene površine kod različitih postupaka brušenja, Strojarstvo 35(5,6) 231-235 (1993).
[5] MONTGOMERY, D.C.: Design and Analysis of Experiments, John Wiley & Sons, Inc., New York, 1997.
[6] CEBALO, R.: Prepoznavanje materijala i automatsko određivanje elemenata rezanja kod tokarenja, Zbornik II, Suvremeni trendovi proizvodnog strojarstva, Zagreb, 1992.
Source: https://bib.irb.hr/datoteka/252583.Bajic-Majce-eng.doc
Web site to visit: https://bib.irb.hr/
Author of the text: indicated on the source document of the above text
If you are the author of the text above and you not agree to share your knowledge for teaching, research, scholarship (for fair use as indicated in the United States copyrigh low) please send us an e-mail and we will remove your text quickly. Fair use is a limitation and exception to the exclusive right granted by copyright law to the author of a creative work. In United States copyright law, fair use is a doctrine that permits limited use of copyrighted material without acquiring permission from the rights holders. Examples of fair use include commentary, search engines, criticism, news reporting, research, teaching, library archiving and scholarship. It provides for the legal, unlicensed citation or incorporation of copyrighted material in another author's work under a four-factor balancing test. (source: http://en.wikipedia.org/wiki/Fair_use)
The information of medicine and health contained in the site are of a general nature and purpose which is purely informative and for this reason may not replace in any case, the council of a doctor or a qualified entity legally to the profession.
The texts are the property of their respective authors and we thank them for giving us the opportunity to share for free to students, teachers and users of the Web their texts will used only for illustrative educational and scientific purposes only.
All the information in our site are given for nonprofit educational purposes