Performance Measurement
1.1 Performance measurement aims to establish how well something or somebody is doing in relation to a plan. Performance measures may be divided into two groups.
(a) Financial performance indicators
(b) Non-financial performance indicators
1.2 Different measures are appropriate for different businesses. Factors to consider:
(a) Measurement needs resources – people, equipment and time to collect and analyse information. The costs and benefits of providing resources to produce a performance indicator must be carefully weighed up.
(b) Performance must be measured in relation to something, otherwise measurement is meaningless. Overall performance should be measured against the objectives of the organization and the plans that result from those objectives. If the organisation has no clear objectives, the first step in performance measurement is to set them. The second is to identify the factors that are critical to the success of those objectives.
(c) Measures must be relevant. This means finding out what the organisation does and how it does it so that measures reflect what actually occurs.
(d) Short and long-term achievement should be measured. Short-term targets can be valuable, but exclusive use of them may direct the organisation away from opportunities that will mean success for the business in the long-term.
(e) Measures should be fair. They should only include factors which managers can control by their decisions, and for which they can be held responsible. Measuring controllable costs, revenues and assets may prove controversial however.
(f) A variety of measures should be used. Managers may be able to find ways to distort a single measure, but should not be able to affect a variety of measures. The balanced scorecard provides a method of measuring performance from a number of perspectives.
(g) Realistic estimates may be required for measures to be employed. These include estimates of financial items whose value is not certain, such as the cost of capital, and estimates of the impact of non-financial items.
(h) Measurement needs responses, above all managers to make decisions in the best interests of the organisation. Managers will only respond to measures that they find useful. The management accountant therefore needs to adopt a modern marketing philosophy to the provision of performance measures: satisfy customer wants, not pile 'em high and sell 'em cheap.
1.3 Once suitable performance measures have been selected they must be monitored on a regular basis to ensure that they are providing useful information. There is little point in an organisation devoting considerable resources to measuring market share if an increase in market share is not one of the organisation's objectives.
2. Financial Performance Indicators (FPIs)
2.1 Financial performance indicators analyse profitability, liquidity and risk. Financial indicators include:
(a) Profitability
(b) Gearing
(c) Liquidity, etc.
2.2 Summary of ratio:
Group |
Ratio |
Formula |
1. Liquidity |
(a) Current ratio |
Current assets/current liabilities |
|
(b) Acid test |
(Current assets – stock)/current liabilities |
2. Profitability |
(a) Gross profit margin |
Gross profit / sales |
|
(b) Net profit margin |
PBIT / sales |
|
(c) Return on capital employed |
PBIT / capital employed × 100% |
|
(d) EPS |
Earnings / No. of shares |
3. Management efficiency |
(a) Stock turnover |
Average stock held/annual cost of sales × 365 |
|
(b) Debtors collection period |
Average debtors/annual credit sales × 365 |
|
(c) Creditors turnover period |
Average trade creditors/annual credit purchases × 365 |
4. Financial risk |
(a) Debt ratio |
Total liabilities/total assets × 100% |
|
(c) Gearing ratio |
Long term debt/capital employed × 100% |
|
(d) Interest cover |
PBIT/interest charges |
3. Non-Financial Performance Indicators (NFPIs)
3.1 A firm’s success usually involves focusing on a small number of critical areas where they must win. These critical success factors (CSFs) vary from business to business but could include, e.g.
(a) Having a wide range of products that people want.
(b) Brand name.
(c) Low prices.
(d) Quick delivery.
(e) Customer satisfaction.
3.2 Most of these are best assessed using non-financial performance indicators. Financial performance appraisal often reveals the ultimate effect of operational factors and decisions but non-financial indicators are needed to monitor causes.
3.3 The areas of performance criteria will vary. Some of the criteria, and control and measurement used, are as follows:
Competitiveness |
|
Activity |
|
Productivity |
|
Quality of service |
|
Customer satisfaction |
|
Quality of working life |
|
Innovation |
|
4. Benchmarking
4.1 Concept of benchmarking
4.1.1 Benchmarking is a process of comparing your own performance against the performance of someone else, preferably the performance of ‘the best’.
4.1.2 The purpose of benchmarking is to identify differences between your performance and the performance of the selected benchmark. Where these differences are significant, methods of closing the gap and raising performance can be considered. One way of improving performance might be to copy the practices of the ‘ideal’ or benchmark.
4.1.3 In strategic position analysis, benchmarking is useful because it provides an assessment of how well or badly an entity is performing in comparison with competitors.
4.2 Methods of benchmarking
4.2.1 Internal benchmarking. An entity might compare the performance of units within the organisation with the best-performing unit. For example, an organisation with 30 branch offices might compare the performance of 29 of the branches with the best-performing branch.
4.2.2 Operational benchmarking. An entity might compare the performance of a particular operation with the performance of a similar operation in a different business entity in a different industry. For example, a book publishing company might compare its order handling, warehousing and despatch systems with the similar systems of a company in a different industry that has a reputation for excellence – for example a company in the clothing manufacturing industry. Operational benchmarking arrangements might be negotiated with another business entity.
4.2.3 Competitive benchmarking. An entity might compare its own performance and its own products with those of its most successful competitors. Unlike internal benchmarking and operational benchmarking, competitive benchmarking must be carried out without the knowledge and co-operation of the selected benchmark.
4.2.4 Customer benchmarking. This is a different type of benchmark. The benchmark is a specification of what customers expect. An entity compares its performance against what its customers expect the performance to be.
4.2.5 |
Example 1 |
|
Competitive benchmarking originated with the Xerox Corporation in the US in 1982. The company manufactured photocopier machines, but had lost a large part of its market share to Japanese competitors. The corporation set up a team to compare Xerox against its competitors. The team identified critical success factors and performance indicators is several different areas of operations, such as order fulfilment, the distribution of products to customers, production costs, selling prices and product features. It then compared it’s own performance in each area with the performance of the competitors. The comparison showed that Xerox was seriously under performing in comparison with the competition. Its management therefore went on to consider measures that it should take to improve its performance. As a result of the measures it took, Xerox was able to reduce its costs, improve customer satisfaction, and regain some of its lost market share. In other words, competitive benchmarking helped the corporation to regain competitiveness. |
4.3 Advantages of benchmarking
4.3.1 Benchmarking has the following advantages:
(a) Position audit. Benchmarking can assess a firm’s existing position, and provide a basis for establishing standards of performance.
(b) The comparisons are carried out by the managers who have to live with any changes implemented as a result of the exercise.
(c) Benchmarking focuses on improvement in key areas and sets targets which are challenging but evidently achievable.
(d) The sharing of information can be a spur to innovation.
(e) The result should be improved performance, particularly in cost control and delivering value.
4.4 Disadvantages of benchmarking
4.4.1 Benchmarking has the following disadvantages:
(a) It implies there is one best way of doing business – arguably, this boils down to the difference between efficiency and effectiveness. A process can be efficient but its output may not be useful. Other measures (such as amending the value chain) may be a better way of securing competitive advantage.
(b) The benchmark may be yesterday's solution to tomorrow's problem. For example, a ferry company crossing the English Channel might benchmark its activities (eg speed of turnaround at Dover in the UK and Calais in France, cleanliness on ship) against another ferry company, whereas the real competitor is the Channel Tunnel linking London and Paris by road or train. There is a danger of drawing incorrect conclusions from inappropriate comparisons.
(c) It is a catching-up exercise rather than the development of anything distinctive. After the benchmarking exercise, the competitor might improve performance in a different way.
(d) It depends on accurate information about comparator companies – it may be hard to persuade other organisations to share information.
(e) It can be difficult to decide which activities to benchmark.
(f) It may be difficult to identify the 'best in class' for each activity.
(g) Successful practices in one organisation may not transfer successfully to another.
5. Balanced Scorecard and Performance Measurement
5.1 |
Balanced Scorecard |
|
The balanced scorecard approach to performance measurement focuses on four different perspectives and uses financial and non-financial indicators. |
5.2 The balanced scorecard focuses on four different perspectives, as follows:
Perspectives |
Question |
Explanation |
Financial |
How do we create value for our shareholders? |
Covers traditional measures such as growth, profitability and shareholder value but set through talking to the shareholder or shareholders direct |
Customer |
What do existing and new customers value from us? |
Gives rise to targets that matter to customers: cost, quality, delivery, inspection, handling and so on |
Internal |
What processes must we excel at to achieve our financial and customer objectives? |
Aims to improve internal processes and decision making |
Innovation and learning |
Can we continue to improve |
Considers the business's capacity to maintain its competitive position through the acquisition of new skills and the development of new products |
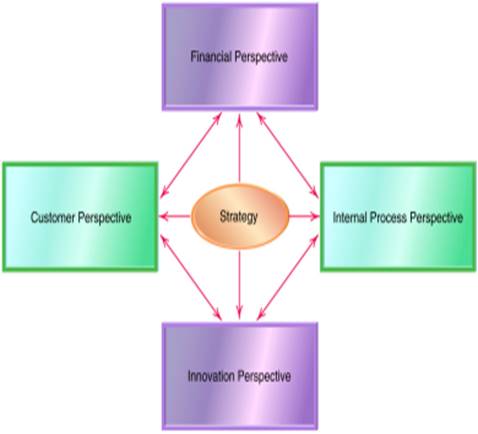

5.3 The scorecard is 'balanced' as managers are required to think in terms of all four perspectives, to prevent improvements being made in one area at the expense of another.
5.4 Important features of this approach are as follows:
(a) It looks at both internal and external matters concerning the organisation.
(b) It is related to the key elements of a company's strategy.
(c) Financial and non-financial measures are linked together.
(d) It helps to communicate the strategy to all members of the organization by translating the strategy into a coherent and linked set of understandable and measurable operational targets.
5.5 |
Example 2 |
|
An example of how a balanced scorecard might appear is offered below. |
5.6 The cause-and-effect relationship of the various measure in the balanced scorecard are:
(a) Financial measures are lagging performance indicators for the purpose of feedback but not for future-oriented activities and actions.
(b) Customer measures are leading indicators of, and thus affect, financial performance.
(c) Internal business process measures are leading indicators of customer-related measures and future financial performance.
(d) Learning and growth measures affect internal processes which impact customer service which then determines long term financial results.
5.7 |
Benefits of balanced scorecard |
|
(a) The scorecard brings together in a single report of four perspectives on a company’s performance that relate to many of the disparate elements of the company’s competitive agenda. |
5.8 |
Limitations of balanced scorecard |
|
(a) The assumption of the cause-and-effect relationship on the grounds that they are too ambiguous and lack a theoretical underpinning or empirical support. |
Short-termism and Manipulation
6.1 Short-termism is when there is a bias towards short-term rather than long-term performance. It is often due to the fact that managers' performance is measured on short-term results.
6.2 Organisations often have to make a trade-off between short-term and long-term objectives. Decisions which involve the sacrifice of longer-term objectives include the following.
(a) Postponing or abandoning capital expenditure projects, which would eventually contribute to growth and profits, in order to protect short term cash flow and profits.
(b) Cutting R&D expenditure to save operating costs, and so reducing the prospects for future product development.
(c) Reducing quality control, to save operating costs (but also adversely affecting reputation and goodwill).
(d) Reducing the level of customer service, to save operating costs (but sacrificing goodwill).
(e) Cutting training costs or recruitment (so the company might be faced with skills shortages).
6.3 Methods to encourage a long-term view:
(a) Making short-term targets realistic. If budget targets are unrealistically tough, a manager will be forced to make trade-offs between the short and long term.
(b) Providing sufficient management information to allow managers to see what trade-offs they are making. Managers must be kept aware of long-term aims as well as shorter-term (budget) targets.
(c) Evaluating managers' performance in terms of contribution to long-term as well as short-term objectives.
(d) Link managers' rewards to share price. This may encourage goal congruence.
(e) Set quality based targets as well as financial targets. Multiple targets can be used.
7. Building Block Model
7.1 Components of building block
7.1.1 Fitzgerald and Moon's building blocks for dimensions, standards and rewards attempt to overcome the problems associated with performance measurement of service businesses.
7.2 Dimensions
7.2.1 Fitzgerald and Moon proposed six dimensions or areas that organizations should set standard, it can be divided into two sets:
(a) the results (measured by financial and competitive performance), and
(b) the determinants (quality of service, flexibility, resource utilisation and innovation).
7.2.2 Six dimensions:
(a) Competitive performance, focusing on factors such as sales growth and market share.
(b) Financial performance, concentrating on profitability, capital structure and so on.
(c) Quality of service looks at matters like reliability, courtesy and competence.
(d) Flexibility is an apt heading for assessing the organisation's ability to deliver at the right speed, to respond to precise customer specifications, and to cope with fluctuations in demand.
(e) Resource utilisation, not unsurprisingly, considers how efficiently resources are being utilised. This can be problematic because of the complexity of the inputs to a service and the outputs from it and because some of the inputs are supplied by the customer (he or she brings their own hair, for example). Many measures are possible, however, for example 'number of customers per hairdresser'. Performance measures can be devised easily if it is known what activities are involved in the service.
(f) Innovation is assessed in terms of both the innovation process and the success of individual innovations.
7.3 Standards
7.3.1 The three key words to keep in mind:
(a) Ownership
(b) Achievability
(c) Equity (fairness)
7.3.2 Fitzgerald and Moon suggested that the employees should participate in the setting of standards or targets since this would encourage ownership of the target and a commitment to it. They said that the target should be achievable after putting in effort and all targets should be seen to be fair by the employees.
7.3.3 To achieve fairness, adjustments might have to be made, for example, when the divisions operate in different countries, some divisions have advantages in other countries such as cheaper rental, we have to allow for the cheaper overseas rent. In this way all divisions could be compared fairly.
7.4 Rewards
7.4.1 The three key words to keep in mind:
(a) Clarity (clear and understandable)
(b) Motivation
(c) Controllability
7.4.2 Reward structure of performance measurement system should guide individuals to work towards standards. Fitzgerald and Moon suggested that any reward system should be easily understood, concern conditions that are controllable by the employees and motivate them to strive for more (probably by giving bonuses for achieving standard).
8. Common Size Trend Analysis and Index Analysis
8.1 Common size analysis
8.1.1 Common size analysis can be used to compare or benchmark financial performance against other firms within the same industry; and to get a different picture about trends for one firm.
8.1.2 Using this approach for each line item in the income statement (or statement of financial position) is expressed as a percentage of sales (or total assets). Common size analysis is a useful way of comparing the financial results of organisations of different size, because percentage values are more easily compared.
8.1.3 Common size analysis can be used either for making comparisons between different companies, or for within-company comparisons to identify any changes or trends over time.
8.1.4 |
Example 3 |
|
Consider the following income statements and common size income statements for a company in the electronics industry for the past three years, Years 1 to 3.
To calculate the percentages we divide each number by the total sales for the year. An analysis of the trends over the three years shows that the gross profit margin has been increasing, but the operating profit margin has been falling. This is due mainly to an increase in administration costs, as a percentage of sales. |
8.1.5 |
Example 4 |
|
Company Zhou Inc
* To calculate the common size statement of financial position numbers we just divide each number by total assets. So, for example, The percentage for plant and equipment for 20X8 is: Inventory also decreased slightly relative to total assets – good news as inventory earns no return sitting in a warehouse, yet some inventory levels need to be maintained in order to satisfy customer demand (unless the firm uses a JIT system and are very confident that their suppliers can deliver – but this is not always the case, especially in Hong Kong). Other current assets have remained relatively stable over the three-year period, while investment in non-current assets has decreased relative to total assets from 20X8 to 20X9. This may be due to accounting or to real economic reasons or both. Further investigation is required. The mix of how the assets are funded can be seen in the total liabilities and equity section. Total debt (short and long-term debt) has fallen as a percentage of total assets, with some of this being taken up by paid up capital. This means less of a future cash burden on the company because paid up capital represents funding which does not attract a requirement to pay a regular cash payment. This is because dividends are paid at the discretion of the directors. Debt, on the other hand means the company must pay interest (and principal) each period regardless of how the company is performing. Zhou Company also seems to be making much better use of its accounts payable funding. Accounts payable is (usually), interest free so the longer the payment can be deferred the better. However, relationships with suppliers are very important and they must be nurtured and maintained at a good level so the company can carry out its operations and satisfy its own customers. A balance needs to be achieved. |
8.2 Index analysis
8.2.1 We can also perform an index analysis when looking at trends. Index analysis expresses the amounts of a particular income statement or statement of financial position item as a percentage of the amounts of that same item in the base year. The base year is selected by the analyst as the starting point for the trend analysis. With index analysis we see how an item has changed over time relative to itself.
8.2.2 |
Example 5 |
|
An index analysis, using the same figures as in the previous example, is shown in the following table. For example, the cash balance in 20X9 is 6.89 times the balance of cash in 20X7 (i.e. 310/45).
|
Examination Style Question
Question 2 (15 marks – approximately 27 minutes)
Chung Wa Limited is a manufacturing company whose shares are listed on the Hong Kong Stock Exchange’s Main Board. You have calculated a set of ten financial ratios for Chung Wa, and prepared a table comparing the company’s ratios with the industry average:
2003 Ratio |
Chung Wa |
Industry Average |
Current assets/current liabilities |
1.9x |
2.0x |
Days sales outstanding |
75 days |
35 days |
Sales/inventories |
6.6x |
6.7x |
Sales/total assets |
1.7x |
3.0x |
Depreciation expense/total assets |
2.8% |
1.5% |
Net income/sales |
1.7% |
1.2% |
Net income/total assets |
2.9% |
3.6% |
Net income/shareholders’ equity |
7.6% |
9.0% |
Bad debt ratio to credit sales |
4.1% |
2.6% |
Total debt/total assets |
62.0% |
60.0% |
Required:
(a) Outline Chung Wa’s strengths and weaknesses, as revealed by the above table.
(8 marks)
(b) Suppose Chung Wa had received a special order in 2003 leading to a 50% increase of its sales, as well as its inventories and accounts receivable, yet expects a return to normal during 2004. How would that affect the overall picture of the company and which ratio would be most affected as a result? (4 marks)
(c) What are the limitations of such ratio analysis? (3 marks)
(HKICPA Module B May 2004 Q3)
Question 3 – Financial and Non-financial Measurement
Ties Only is a new business, selling high quality imported men’s ties via the internet. The managers, who also own the company, are young and inexperienced but they are prepared to take risks. They are confident that importing quality ties and selling via a website will be successful and that the business will grow quickly. This is despite the well recognised fact that selling clothing is a very competitive business.
They were prepared for a loss-making start and decided to pay themselves modest salaries (included in administration expenses in table 1 below) and pay no dividends for the foreseeable future.
The owners are so convinced that growth will quickly follow that they have invested enough money in website server development to ensure that the server can handle the very high levels of predicted growth. All website development costs were written off as incurred in the internal management accounts that are shown below in table 1.
Significant expenditure on marketing was incurred in the first two quarters to launch both the website and new products. It is not expected that marketing expenditure will continue to be as high in the future.
Customers can buy a variety of styles, patterns and colours of ties at different prices.
The business’s trading results for the first two quarters of trade are shown below in table 1
Table 1
|
Quarter 1 |
Quarter 2 |
||
|
$ |
$ |
$ |
$ |
Sales |
|
420,000 |
|
680,000 |
Less: Cost of sales |
|
(201,600) |
|
(340,680) |
Gross profit |
|
218,400 |
|
339,320 |
Less: Expenses |
|
|
|
|
Website development |
120,000 |
|
90,000 |
|
Administration |
100,500 |
|
150,640 |
|
Distribution |
20,763 |
|
33,320 |
|
Launch marketing |
60,000 |
|
40,800 |
|
Other variable expenses |
50,000 |
|
80,000 |
|
Total expenses |
|
(351,263) |
|
(394,760) |
Loss for quarter |
|
(132,863) |
|
(55,440) |
Required:
(a) Assess the financial performance of the business during its first two quarters using only the data in table 1 above. (12 marks)
(b) Briefly consider whether the losses made by the business in the first two quarters are a true reflection of the current and likely future performance of the business. (4 marks)
The owners are well aware of the importance of non-financial indicators of success and therefore have identified a small number of measures to focus on. These are measured monthly and then combined to produce a quarterly management report.
The data for the first two quarters management reports is shown below:
Table 2
|
Quarter 1 |
Quarter 2 |
Website hits* |
690,789 |
863,492 |
Number of ties sold |
27,631 |
38,857 |
On time delivery |
95% |
89% |
Sales returns |
12% |
18% |
System downtime |
2% |
4% |
* A website hit is automatically counted each time a visitor to the website opens the home page of Ties Only.
The industry average conversion rate for website hits to number of ties sold is 3·2%. The industry average sales return rate for internet-based clothing sales is 13%.
Required:
(c) Comment on each of the non-financial data in table 2 above taking into account, where appropriate, the industry averages provided, providing your assessment of the performance of the business. (9 marks)
(Total 25 marks)
Question 1 – Financial Performance and Balanced Scorecard The business was founded by and is wholly owned by Richard Preston, a dominant and aggressive sole practitioner. He feels that promotion of new products to his clients would be likely to upset the conservative nature of his dentists and doctors and, as a result, the business has been managed with similar products year on year. You have been provided with financial information relating to the practice in appendix 1. In appendix 2, you have been provided with non-financial information which is based on the balanced scorecard format. Appendix 1: Financial information
Appendix 2: Balanced Scorecard (extract)
Customer Knowledge
Learning and growth
Notes Required: (a) Using the information in appendix 1 only, comment on the financial performance of the business (briefly consider growth, profitability, liquidity and credit management). |
Source: https://hkiaatevening.yolasite.com/resources/QPMBNotes/Ch13-PerformanceMeasurement.doc
Web site to visit: https://hkiaatevening.yolasite.com
Author of the text: indicated on the source document of the above text
If you are the author of the text above and you not agree to share your knowledge for teaching, research, scholarship (for fair use as indicated in the United States copyrigh low) please send us an e-mail and we will remove your text quickly. Fair use is a limitation and exception to the exclusive right granted by copyright law to the author of a creative work. In United States copyright law, fair use is a doctrine that permits limited use of copyrighted material without acquiring permission from the rights holders. Examples of fair use include commentary, search engines, criticism, news reporting, research, teaching, library archiving and scholarship. It provides for the legal, unlicensed citation or incorporation of copyrighted material in another author's work under a four-factor balancing test. (source: http://en.wikipedia.org/wiki/Fair_use)
The information of medicine and health contained in the site are of a general nature and purpose which is purely informative and for this reason may not replace in any case, the council of a doctor or a qualified entity legally to the profession.
The texts are the property of their respective authors and we thank them for giving us the opportunity to share for free to students, teachers and users of the Web their texts will used only for illustrative educational and scientific purposes only.
All the information in our site are given for nonprofit educational purposes