Chapter 18 Performance Measurement
1. Objectives
1.1 Describe, calculate and interpret financial performance indicators (FPIs) for profitability, liquidity and risk in both manufacturing and service businesses. Suggest methods to improve these measures.
1.2 Describe, calculate and interpret non-financial performance indicators (NFPIs) and suggest methods to improve the performance indicated.
1.3 Explain the causes and problems created by short-termism and financial manipulation of results and suggest methods to encourage a long term view.
1.4 Explain and interpret the Balanced Scorecard, and the Building Block model proposed by Fitzgerald and Moon.
2. Performance Measurement
2.1 Performance measurement aims to establish how well something or somebody is doing in relation to a plan. Performance measures may be divided into two groups.
(a) Financial performance indicators
(b) Non-financial performance indicators
2.2 Different measures are appropriate for different businesses. Factors to consider:
(a) Measurement needs resources – people, equipment and time to collect and analyse information. The costs and benefits of providing resources to produce a performance indicator must be carefully weighed up.
(b) Performance must be measured in relation to something, otherwise measurement is meaningless. Overall performance should be measured against the objectives of the organization and the plans that result from those objectives. If the organisation has no clear objectives, the first step in performance measurement is to set them. The second is to identify the factors that are critical to the success of those objectives.
(c) Measures must be relevant. This means finding out what the organisation does and how it does it so that measures reflect what actually occurs.
(d) Short and long-term achievement should be measured. Short-term targets can be valuable, but exclusive use of them may direct the organisation away from opportunities that will mean success for the business in the long-term.
(e) Measures should be fair. They should only include factors which managers can control by their decisions, and for which they can be held responsible. Measuring controllable costs, revenues and assets may prove controversial however.
(f) A variety of measures should be used. Managers may be able to find ways to distort a single measure, but should not be able to affect a variety of measures. The balanced scorecard provides a method of measuring performance from a number of perspectives.
(g) Realistic estimates may be required for measures to be employed. These include estimates of financial items whose value is not certain, such as the cost of capital, and estimates of the impact of non-financial items.
(h) Measurement needs responses, above all managers to make decisions in the best interests of the organisation. Managers will only respond to measures that they find useful. The management accountant therefore needs to adopt a modern marketing philosophy to the provision of performance measures: satisfy customer wants, not pile 'em high and sell 'em cheap.
2.3 Once suitable performance measures have been selected they must be monitored on a regular basis to ensure that they are providing useful information. There is little point in an organisation devoting considerable resources to measuring market share if an increase in market share is not one of the organisation's objectives.
3. Financial Performance Indicators (FPIs)
3.1 Financial performance indicators analyse profitability, liquidity and risk. Financial indicators include:
(a) Profitability
(b) Gearing
(c) Liquidity, etc.
3.2 Summary of ratio:
Group |
Ratio |
Formula |
1. Liquidity |
(a) Current ratio |
Current assets/current liabilities |
|
(b) Acid test |
(Current assets – stock)/current liabilities |
2. Profitability |
(a) Gross profit margin |
Gross profit / sales |
|
(b) Net profit margin |
PBIT / sales |
|
(c) Return on capital employed |
PBIT / capital employed x 100% |
|
(d) EPS |
Earnings / No. of shares |
3. Management efficiency |
(a) Stock turnover |
Average stock held/annual cost of sales x 365 |
|
(b) Debtors collection period |
Average debtors/annual credit sales x 365 |
|
(c) Creditors turnover period |
Average trade creditors/annual credit purchases x 365 |
4. Financial risk |
(a) Debt ratio |
Total liabilities/total assets x 100% |
|
(c) Gearing ratio |
Long term debt/capital employed x 100% |
|
(d) Interest cover |
PBIT/interest charges |
4. Non-Financial Performance Indicators (NFPIs)
4.1 A firm’s success usually involves focussing on a small number of critical areas where they must win. These critical success factors (CSFs) vary from business to business but could include, e.g.
(a) Having a wide range of products that people want.
(b) Brand name.
(c) Low prices.
(d) Quick delivery.
(e) Customer satisfaction.
4.2 Most of these are best assessed using non-financial performance indicators. Financial performance appraisal often reveals the ultimate effect of operational factors and decisions but non-financial indicators are needed to monitor causes.
4.3 The areas of performance criteria will vary. Some of the criteria, and control and measurement used, are as follows:
Competitiveness |
|
Activity |
|
Productivity |
|
Quality of service |
|
Customer satisfaction |
|
Quality of working life |
|
Innovation |
|
5. Balanced Scorecard and Performance Measurement
5.1 |
Balanced Scorecard |
|
The balanced scorecard approach to performance measurement focuses on four different perspectives and uses financial and non-financial indicators. |
5.2 The balanced scorecard focuses on four different perspectives, as follows:
Perspectives |
Question |
Explanation |
Financial |
How do we create value for our shareholders? |
Covers traditional measures such as growth, profitability and shareholder value but set through talking to the shareholder or shareholders direct |
Customer |
What do existing and new customers value from us? |
Gives rise to targets that matter to customers: cost, quality, delivery, inspection, handling and so on |
Internal |
What processes must we excel at to achieve our financial and customer objectives? |
Aims to improve internal processes and decision making |
Innovation and learning |
Can we continue to improve |
Considers the business's capacity to maintain its competitive position through the acquisition of new skills and the development of new products |
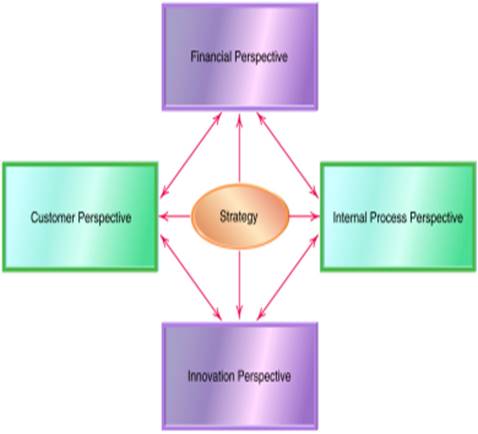

5.3 The scorecard is 'balanced' as managers are required to think in terms of all four perspectives, to prevent improvements being made in one area at the expense of another.
5.4 Important features of this approach are as follows:
(a) It looks at both internal and external matters concerning the organisation.
(b) It is related to the key elements of a company's strategy.
(c) Financial and non-financial measures are linked together.
(d) It helps to communicate the strategy to all members of the organization by translating the strategy into a coherent and linked set of understandable and measurable operational targets.
5.5 |
Example 1 |
|
An example of how a balanced scorecard might appear is offered below. |
5.6 The cause-and-effect relationship of the various measure in the balanced scorecard are:
(a) Financial measures are lagging performance indicators for the purpose of feedback but not for future-oriented activities and actions.
(b) Customer measures are leading indicators of, and thus affect, financial performance.
(c) Internal business process measures are leading indicators of customer-related measures and future financial performance.
(d) Learning and growth measures affect internal processes which impact customer service which then determines long term financial results.
5.7 |
Benefits of balanced scorecard |
|
(a) The scorecard brings together in a single report of four perspectives on a company’s performance that relate to many of the disparate elements of the company’s competitive agenda. |
5.8 |
Limitations of balanced scorecard |
|
(a) The assumption of the cause-and-effect relationship on the grounds that they are too ambiguous and lack a theoretical underpinning or empirical support. |
6. Short-termism and Manipulation
6.1 Short-termism is when there is a bias towards short-term rather than long-term performance. It is often due to the fact that managers' performance is measured on short-term results.
6.2 Organisations often have to make a trade-off between short-term and long-term objectives. Decisions which involve the sacrifice of longer-term objectives include the following.
(a) Postponing or abandoning capital expenditure projects, which would eventually contribute to growth and profits, in order to protect short term cash flow and profits.
(b) Cutting R&D expenditure to save operating costs, and so reducing the prospects for future product development.
(c) Reducing quality control, to save operating costs (but also adversely affecting reputation and goodwill).
(d) Reducing the level of customer service, to save operating costs (but sacrificing goodwill).
(e) Cutting training costs or recruitment (so the company might be faced with skills shortages).
6.3 Methods to encourage a long-term view:
(a) Making short-term targets realistic. If budget targets are unrealistically tough, a manager will be forced to make trade-offs between the short and long term.
(b) Providing sufficient management information to allow managers to see what trade-offs they are making. Managers must be kept aware of long-term aims as well as shorter-term (budget) targets.
(c) Evaluating managers' performance in terms of contribution to long-term as well as short-term objectives.
(d) Link managers' rewards to share price. This may encourage goal congruence.
(e) Set quality based targets as well as financial targets. Multiple targets can be used.
7. Building Block Model
7.1 Fitzgerald and Moon's building blocks for dimensions, standards and rewards attempt to overcome the problems associated with performance measurement of service businesses.
7.2 Standards
7.2.1 The three key words to keep in mind:
(a) Ownership
(b) Achievability
(c) Equity (fairness)
7.2.2 Fitzgerald and Moon suggested that the employees should participate in the setting of standards or targets since this would encourage ownership of the target and a commitment to it. They said that the target should be achievable after putting in effort and all targets should be seen to be fair by the employees.
7.2.3 To achieve fairness, adjustments might have to be made, for example, when the divisions operate in different countries, some divisions have advantages in other countries such as cheaper rental, we have to allow for the cheaper overseas rent. In this way all divisions could be compared fairly.
7.3 Rewards
7.3.1 The three key words to keep in mind:
(a) Clarity (clear and understandable)
(b) Motivation
(c) Controllability
7.3.2 Reward structure of performance measurement system should guide individuals to work towards standards. Fitzgerald and Moon suggested that any reward system should be easily understood, concern conditions that are controllable by the employees and motivate them to strive for more (probably by giving bonuses for achieving standard).
7.4 Dimensions
7.4.1 Fitzgerald and Moon proposed six dimensions or areas that organizations should set standard, it can be divided into two sets:
(a) the results (measured by financial and competitive performance), and
(b) the determinants (quality of service, flexibility, resource utilisation and innovation).
7.4.2 Six dimensions:
(a) Competitive performance, focusing on factors such as sales growth and market share.
(b) Financial performance, concentrating on profitability, capital structure and so on.
(c) Quality of service looks at matters like reliability, courtesy and competence.
(d) Flexibility is an apt heading for assessing the organisation's ability to deliver at the right speed, to respond to precise customer specifications, and to cope with fluctuations in demand.
(e) Resource utilisation, not unsurprisingly, considers how efficiently resources are being utilised. This can be problematic because of the complexity of the inputs to a service and the outputs from it and because some of the inputs are supplied by the customer (he or she brings their own hair, for example). Many measures are possible, however, for example 'number of customers per hairdresser'. Performance measures can be devised easily if it is known what activities are involved in the service.
(f) Innovation is assessed in terms of both the innovation process and the success of individual innovations.
Examination Style Questions
Question 1 – Financial Performance and Balanced Scorecard
The following information relates to Preston Financial Services, an accounting practice. The business specialises in providing accounting and taxation work for dentists and doctors. In the main the clients are wealthy, self-employed and have an average age of 52.
The business was founded by and is wholly owned by Richard Preston, a dominant and aggressive sole practitioner. He feels that promotion of new products to his clients would be likely to upset the conservative nature of his dentists and doctors and, as a result, the business has been managed with similar products year on year.
You have been provided with financial information relating to the practice in appendix 1. In appendix 2, you have been provided with non-financial information which is based on the balanced scorecard format.
Appendix 1: Financial information
|
Current year |
Previous year |
Turnover ($000) |
945 |
900 |
Net profit ($000) |
187 |
180 |
Average cash balances ($000) |
21 |
20 |
Average debtor / trade receivables days (industry average 30 days) |
18 days |
22 days |
Inflation rate (%) |
3 |
3 |
Appendix 2: Balanced Scorecard (extract)
Internal Business Processes
|
Current year |
Previous year |
Error rates in jobs done |
16% |
10% |
Average job completion time |
7 weeks |
10 weeks |
Customer Knowledge
|
Current year |
Previous year |
Number of customers |
1,220 |
1,500 |
Average fee levels ($) |
775 |
600 |
Market share |
14% |
20% |
Learning and growth
|
Current year |
Previous year |
Percentage of revenue from non-core work |
4% |
5% |
Industry average of the proportion of revenue from non-core work in accounting practices |
30% |
25% |
Employee retention rate |
60% |
80% |
Notes
1. Error rates measure the number of jobs with mistakes made by staff as a proportion of the number of clients serviced
2. Core work is defined as being accountancy and taxation. Non-core work is defined primarily as pension advice and business consultancy. Non-core work is traditionally high margin work
Required:
(a) Using the information in appendix 1 only, comment on the financial performance of the business (briefly consider growth, profitability, liquidity and credit management).
(8 marks)
(b) Explain why non financial information, such as the type shown in appendix 2, is likely to give a better indication of the likely future success of the business than the financial information given in appendix 1. (5 marks)
(c) Using the data given in appendix 2 comment on the performance of the business. Include comments on internal business processes, customer knowledge and learning/growth, separately, and provide a concluding comment on the overall performance of the business. (12 marks)
(Total 25 marks)
(ACCA F5 Performance Management Pilot Paper Q4)
Question 2 – Financial and Non-financial Measurement
Ties Only is a new business, selling high quality imported men’s ties via the internet. The managers, who also own the company, are young and inexperienced but they are prepared to take risks. They are confident that importing quality ties and selling via a website will be successful and that the business will grow quickly. This is despite the well recognised fact that selling clothing is a very competitive business.
They were prepared for a loss-making start and decided to pay themselves modest salaries (included in administration expenses in table 1 below) and pay no dividends for the foreseeable future.
The owners are so convinced that growth will quickly follow that they have invested enough money in website server development to ensure that the server can handle the very high levels of predicted growth. All website development costs were written off as incurred in the internal management accounts that are shown below in table 1.
Significant expenditure on marketing was incurred in the first two quarters to launch both the website and new products. It is not expected that marketing expenditure will continue to be as high in the future.
Customers can buy a variety of styles, patterns and colours of ties at different prices.
The business’s trading results for the first two quarters of trade are shown below in table 1
Table 1
|
Quarter 1 |
Quarter 2 |
||
|
$ |
$ |
$ |
$ |
Sales |
|
420,000 |
|
680,000 |
Less: Cost of sales |
|
(201,600) |
|
(340,680) |
Gross profit |
|
218,400 |
|
339,320 |
Less: Expenses |
|
|
|
|
Website development |
120,000 |
|
90,000 |
|
Administration |
100,500 |
|
150,640 |
|
Distribution |
20,763 |
|
33,320 |
|
Launch marketing |
60,000 |
|
40,800 |
|
Other variable expenses |
50,000 |
|
80,000 |
|
Total expenses |
|
(351,263) |
|
(394,760) |
Loss for quarter |
|
(132,863) |
|
(55,440) |
Required:
(a) Assess the financial performance of the business during its first two quarters using only the data in table 1 above. (12 marks)
(b) Briefly consider whether the losses made by the business in the first two quarters are a true reflection of the current and likely future performance of the business. (4 marks)
The owners are well aware of the importance of non-financial indicators of success and therefore have identified a small number of measures to focus on. These are measured monthly and then combined to produce a quarterly management report.
The data for the first two quarters management reports is shown below:
Table 2
|
Quarter 1 |
Quarter 2 |
Website hits* |
690,789 |
863,492 |
Number of ties sold |
27,631 |
38,857 |
On time delivery |
95% |
89% |
Sales returns |
12% |
18% |
System downtime |
2% |
4% |
* A website hit is automatically counted each time a visitor to the website opens the home page of Ties Only.
The industry average conversion rate for website hits to number of ties sold is 3·2%. The industry average sales return rate for internet-based clothing sales is 13%.
Required:
(c) Comment on each of the non-financial data in table 2 above taking into account, where appropriate, the industry averages provided, providing your assessment of the performance of the business. (9 marks)
(Total 25 marks)
(ACCA F5 Performance Management December 2007 Q2)
Question 3
Oliver is the owner and manager of Oliver’s Salon which is a quality hairdresser that experiences high levels of competition. The salon traditionally provided a range of hair services to female clients only, including cuts, colouring and straightening.
A year ago, at the start of his 2009 financial year, Oliver decided to expand his operations to include the hairdressing needs of male clients. Male hairdressing prices are lower, the work simpler (mainly hair cuts only) and so the time taken per male client is much less.
The prices for the female clients were not increased during the whole of 2008 and 2009 and the mix of services provided for female clients in the two years was the same.
The latest financial results are as follows:
Oliver is disappointed with his financial results. He thinks the salon is much busier than a year ago and was expecting more profit. He has noted the following extra information:
1. Some female clients complained about the change in atmosphere following the introduction of male services, which created tension in the salon.
2. Two new staff were recruited at the start of 2009. The first was a junior hairdresser to support the specialist hairdressers for the female clients. She was appointed on a salary of $9,000 per annum. The second new staff member was a specialist hairdresser for the male clients. There were no increases in pay for existing staff at the start of 2009 after a big rise at the start of 2008 which was designed to cover two years’ worth of increases.
Oliver introduced some non-financial measures of success two years ago.
|
2008 |
2009 |
Number of complaints |
12 |
46 |
Number of male client visits |
0 |
3,425 |
Number of female client visits |
8,000 |
6,800 |
Number of specialist hairdressers for female clients |
4 |
5 |
Number of specialist hairdressers for make clients |
0 |
1 |
Required:
(a) Calculate the average price for hair services per male and female client for each of the years 2008 and 2009. (3 marks)
(b) Assess the financial performance of the Salon using the data above. (11 marks)
(c) Analyse and comment on the non-financial performance of Oliver’s business, under the headings of quality and resource utilisation. (6 marks)
(20 marks)
(ACCA F5 Performance Management June 2009 Q2)
Question 4
Thatcher International Park (TIP) is a theme park and has for many years been a successful business, which has traded profitably. About three years ago the directors decided to capitalise on their success and reduced the expenditure made on new thrill rides, reduced routine maintenance where possible (deciding instead to repair equipment when it broke down) and made a commitment to regularly increase admission prices. Once an admission price is paid customers can use any of the facilities and rides for free.
These steps increased profits considerably, enabling good dividends to be paid to the owners and bonuses to the directors. The last two years of financial results are shown below.
TIP operates in a country where the average rate of inflation is around 1% per annum.
Required:
(a) Assess the financial performance of TIP using the information given above.
(14 marks)
During the early part of 2008 TIP employed a newly qualified management accountant. He quickly became concerned about the potential performance of TIP and to investigate his concerns he started to gather data to measure some non-financial measures of success. The data he has gathered is shown below:
Table 1
Note 1: TIP has 50 rides of different types. It is open 360 days of the year for 10 hours each day
Required:
(b) Assess the quality of the service that TIP provides to its customers using Table 1 and any other relevant data and indicate the risks it is likely to face if it continues with its current policies. (6 marks)
(Total 20 marks)
(ACCA F5 Performance Management December 2009 Q4)
Question 5
The Accountancy Teaching Co (AT Co) is a company specialising in the provision of accountancy tuition courses in the private sector. It makes up its accounts to 30 November each year. In the year ending 30 November 2009, it held 60% of market share. However, over the last twelve months, the accountancy tuition market in general has faced a 20% decline in demand for accountancy training leading to smaller class sizes on courses. In 2009 and before, AT Co suffered from an ongoing problem with staff retention, which had a knock-on effect on the quality of service provided to students. Following the completion of developments that have been ongoing for some time, in 2010 the company was able to offer a far-improved service to students. The developments included:
Extracts from the management accounts for 2009 and 2010 are shown below:
On 1 December 2009, management asked all ‘freelance lecturers’ to reduce their fees by at least 10% with immediate effect (‘freelance lecturers’ are not employees of the company but are used to teach students when there are not enough of AT Co’s own lecturers to meet tuition needs). All employees were also told that they would not receive a pay rise for at least one year. Total lecture staff costs (including freelance lecturers) were $41·663 million in 2009 and were included in cost of sales, as is always the case. Freelance lecturer costs represented 35% of these total lecture staff costs. In 2010 freelance lecture costs were $12·394 million. No reduction was made to course prices in the year and the mix of trainees studying for the different qualifications remained the same. The same type and number of courses were run in both 2009 and 2010 and the percentage of these courses that was run by freelance lecturers as opposed to employed staff also remained the same.
Due to the nature of the business, non-financial performance indicators are also used to assess performance, as detailed below.
Required:
Assess the performance of the business in 2010 using both financial performance indicators calculated from the above information AND the non-financial performance indicators provided.
NOTE: Clearly state any assumptions and show all workings clearly. Your answer should be structured around the following main headings: turnover; cost of sales; gross profit; indirect expenses; net operating profit. However, in discussing each of these areas you should also refer to the non-financial performance indicators, where relevant. (20 marks)
(ACCA F5 Performance Management December 2010 Q2)
Source: https://hkiaatevening.yolasite.com/resources/PMNotes/Ch18-PerformanceMeasure.doc
Web site to visit: https://hkiaatevening.yolasite.com/
Author of the text: indicated on the source document of the above text
If you are the author of the text above and you not agree to share your knowledge for teaching, research, scholarship (for fair use as indicated in the United States copyrigh low) please send us an e-mail and we will remove your text quickly. Fair use is a limitation and exception to the exclusive right granted by copyright law to the author of a creative work. In United States copyright law, fair use is a doctrine that permits limited use of copyrighted material without acquiring permission from the rights holders. Examples of fair use include commentary, search engines, criticism, news reporting, research, teaching, library archiving and scholarship. It provides for the legal, unlicensed citation or incorporation of copyrighted material in another author's work under a four-factor balancing test. (source: http://en.wikipedia.org/wiki/Fair_use)
The information of medicine and health contained in the site are of a general nature and purpose which is purely informative and for this reason may not replace in any case, the council of a doctor or a qualified entity legally to the profession.
The texts are the property of their respective authors and we thank them for giving us the opportunity to share for free to students, teachers and users of the Web their texts will used only for illustrative educational and scientific purposes only.
All the information in our site are given for nonprofit educational purposes